(For LE-8600X/LE-8500X series)
SB-R2TS1
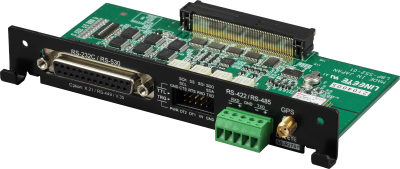
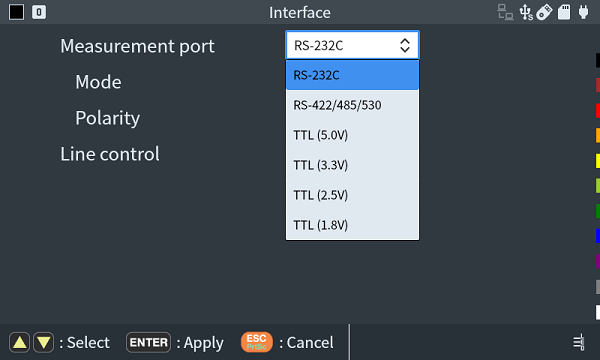
This is an expansion measurement unit for measuring and testing communications on RS-232C, RS-530, RS-422/485, and TTL interfaces. By setting it to an applicable model, it can be used as a multi-protocol analyzer with the same functions as the LE-8500X(R)-RT.
Supports RS-232C, RS-530, RS-422 / RS-485, and TTL just by one unit.
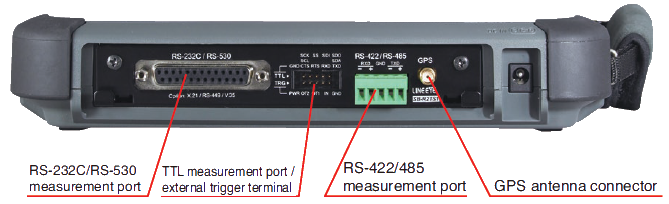
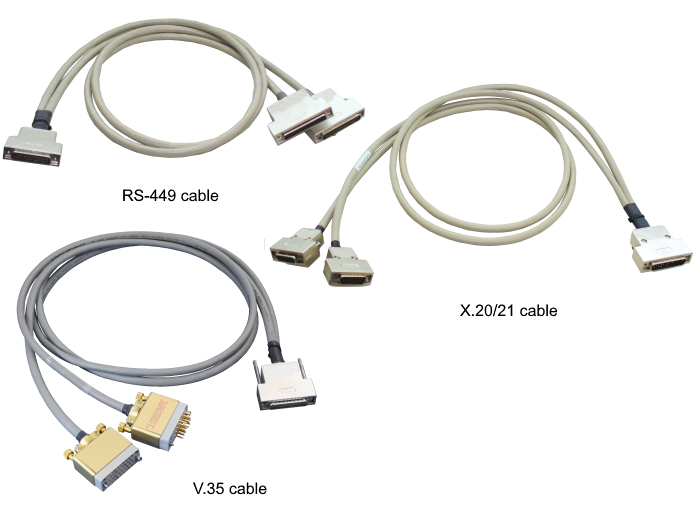
Equipped with four measurement interfaces that cover a wide range of serial communications. As the DSUB measurement port can switch between RS-232C and RS-530, this device can be used for maintenance of equipment with legacy interfaces such as V.35 and X.20 / 21 without replacing the measurement board.※
Supports high-speed serial communication as standard
This analyzer has two modes, one is the standard mode that has flexible and abundant functions, and the other is the high-speed mode that can execute measurement without data loss even with high-speed communication of up to 20 Mbps by processing all data capturing processes by the hardware. It can be switched instantly according to the actual transfer rate of the communication measurement target line.
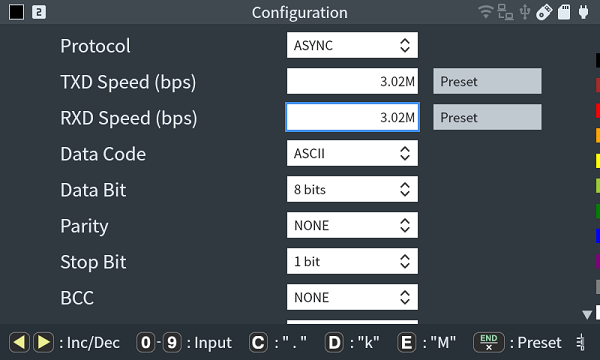
Supports any communication speed
Any communication speed can be set with 4 significant digits. The bit configuration, bit transmission order, polarity, modulation format, etc. can be freely set to meet various test situations.
Standard Mode: 50bps to 12Mbps
High-speed Mode: 50bps to 20Mbps
(Up to 30Mbps for only SPI.)**)
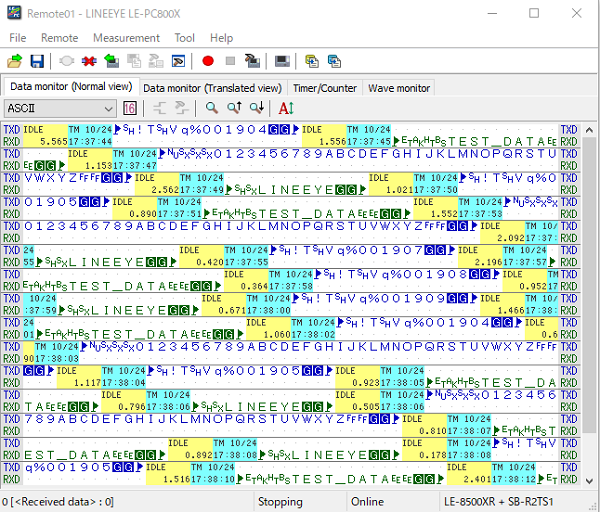
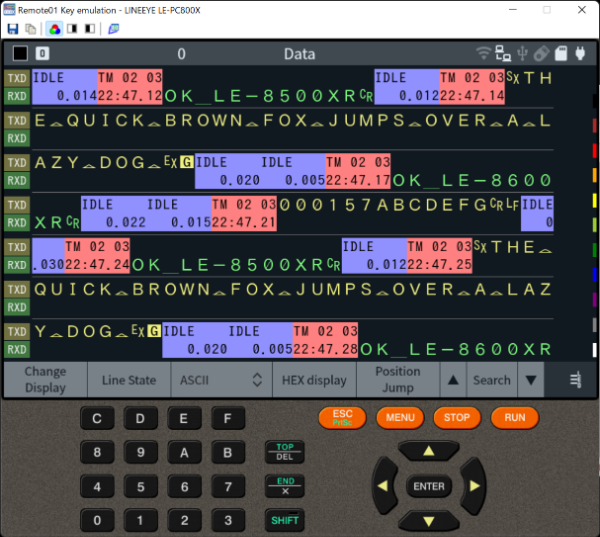
Various monitor displays
You can select a wide variety of online monitor display formats according to the protocol.
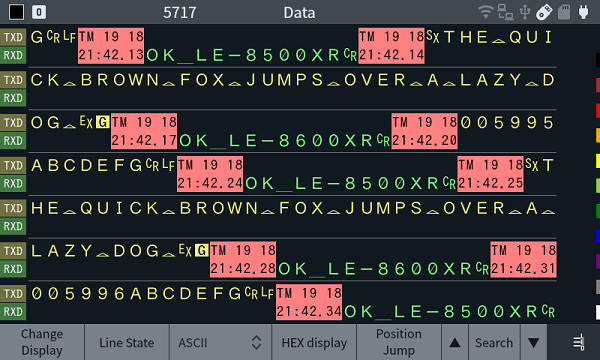
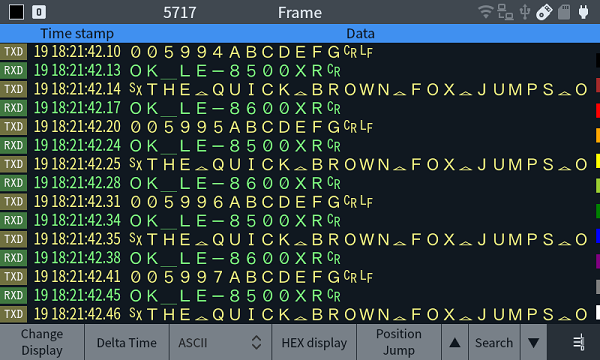
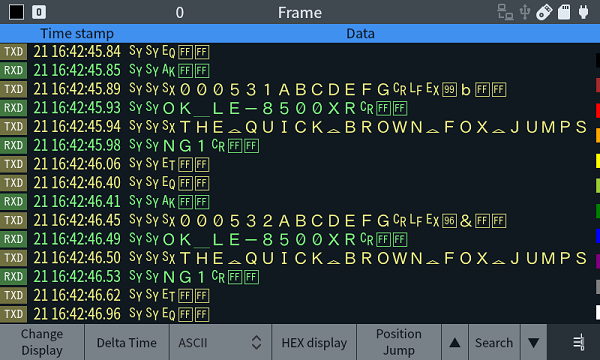
■ ASYNC
[ ASYNC raw data display ]
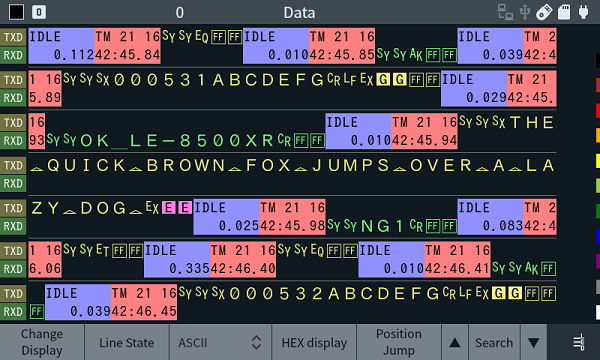
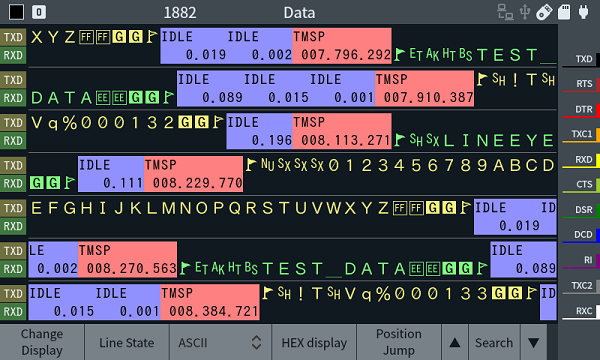
[ ASYNC line display ]
■ Character Synchronous SYNC/BSC
[ SYNC/BSC raw data display ]
[ SYNC/BSC line display ]
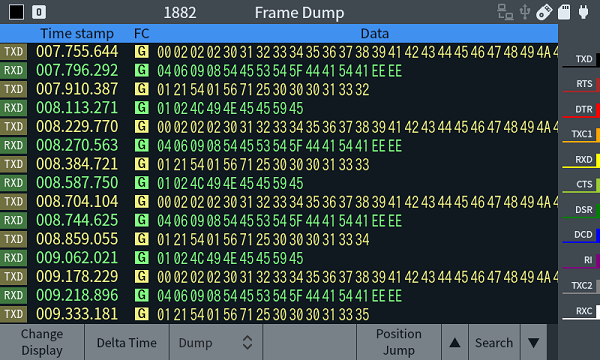
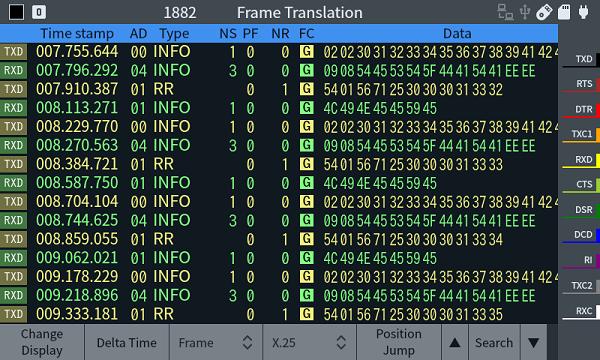
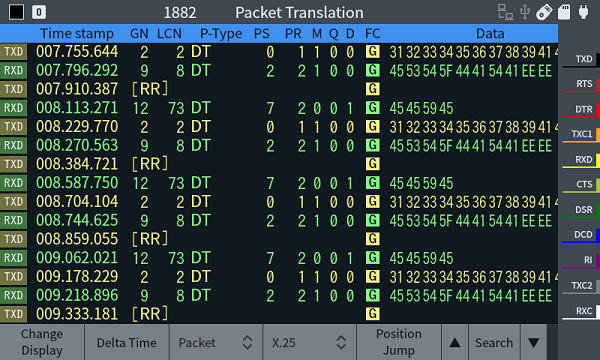
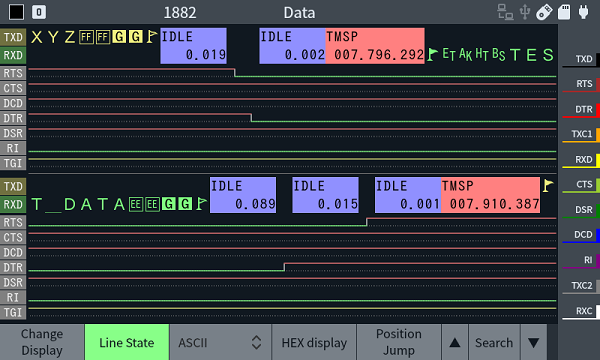
■ Bit Synchronous HDLC/SDLC
[ HDLC raw data display ]
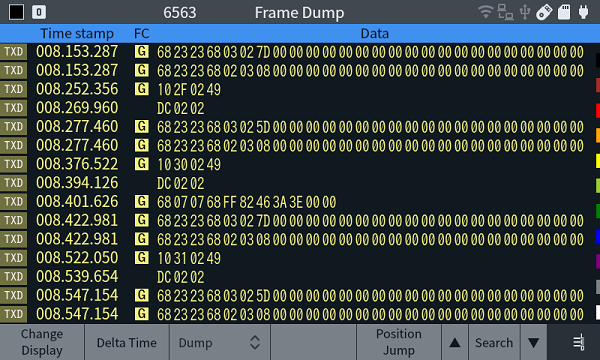
[ HDLC dump display ]
[ X.25 frame display ]
[ X.25 packet display ]
[ HDLC control line display ]
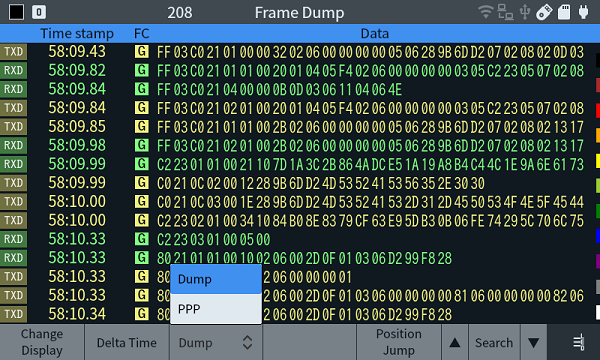
■ ASYNC-PPP
[ ASYNC-PPP raw data display ]
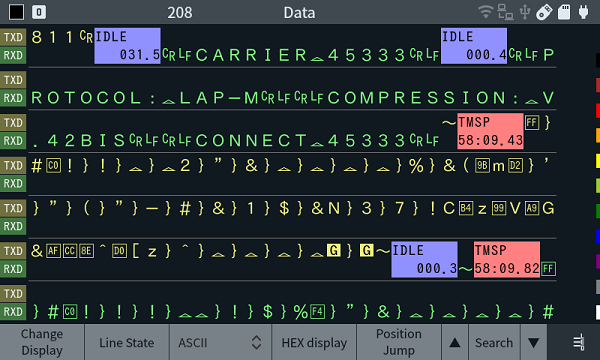
[ ASYNC-PPP translation display ]
![]()
[ ASYNC-PPP dump display ]
■ I2C
[ I2C raw data display ]
[ I2C translation display ]
![]()
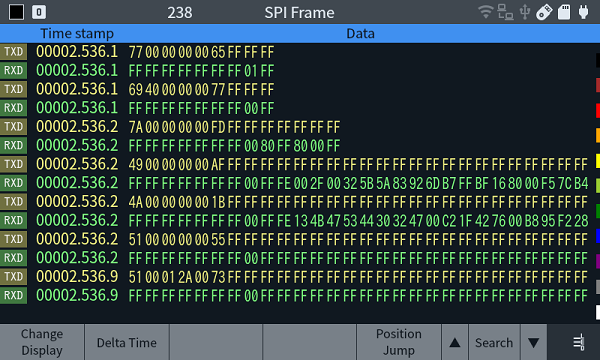
■ SPI
[ SPI raw data display ]
[ SPI line display ]
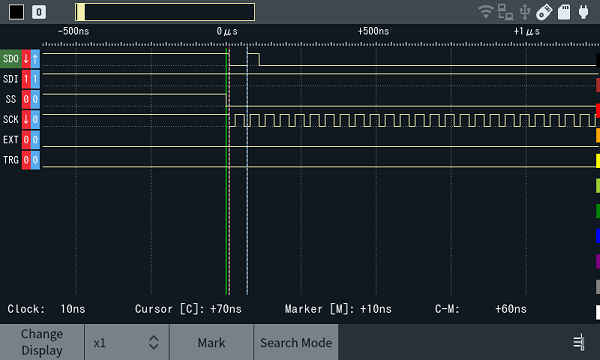
[ SPI logic analzyer display ]
Supports fieldbus protocols Modbus and PROFIBUS as standard
Without adding any options you can monitor and test Modbus, high-speed PROFIBUS, and CC-LINK communication.
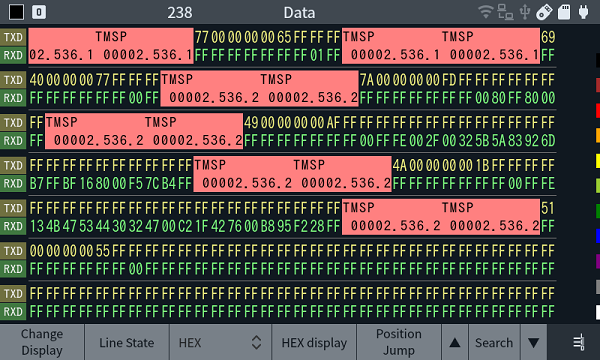
■ Modbus
[ Modbus raw data display ]
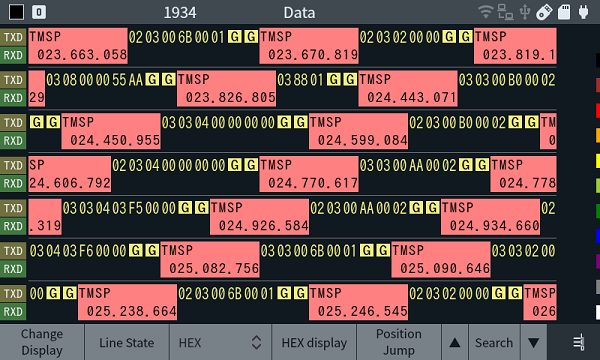
[ Modbus translation display ]
![]()
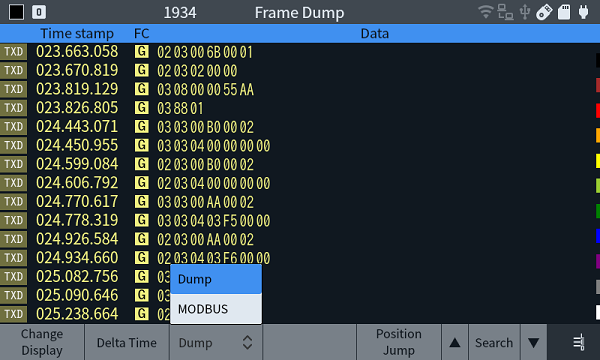
[ Modbus dump display ]
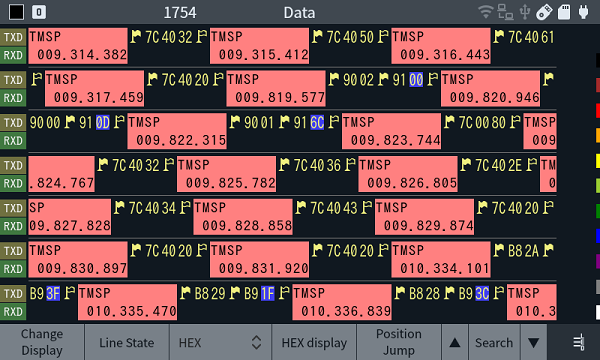
■ Profibus
[ Profibus raw data display ]
[ Profibus translation display ]
![]()
[ Profibus dump display ]
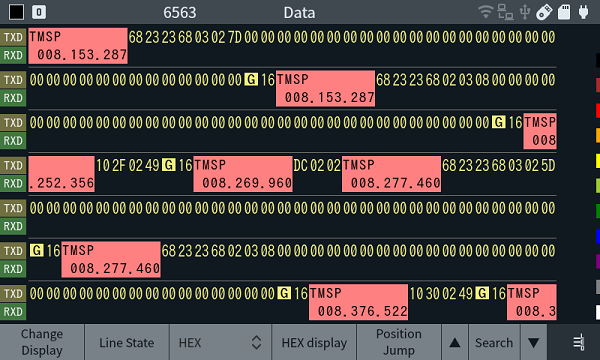
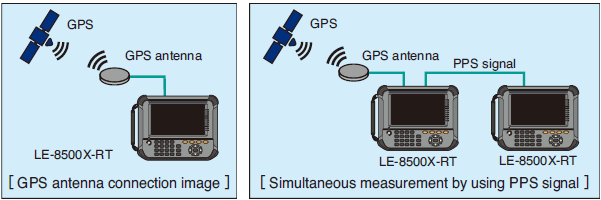
Timestamp which can be time-synchronized by GNSS (PPS) signal
In the case of a time stamp of a crystal oscillator with ±20ppm accuracy in general, there may have a time rag up to 1.7 seconds a day. By using the GNSS/GPS time synchronization function, accurate time stamps corrected in seconds can be added to the monitor data. Thus even when you monitor by using two analyzers two different points simultaneously where communication failures rarely occur while a long period of time, you can compare and verify the measurement data of two units based on the time stamp.
Timestamp and idle time
A time stamp indicating the time when the first data of the communication frame was sent and received can be recorded together with the communication data. Depending on the measurement situation, You can select the real-time timestamps from the options such as month/day/minute/second, day/hour/minute/second 10ms, or elapsed time timestamp of 100µs/10µs/1µs (that can record the elapsed time from the start of measurement with high accuracy).
You can also record the idle time in units of 1ms at minimum, such as non-communication time or control line change timing.
[ Real-time Time Stamp ]
Hr/Min/Sec Recording Type
(compatible with lower models)
TMSP 18 14:27 |
TMSP 06:06:12 |
TMSP 24:53.18 |
| 18days 14hours 27minutes |
6hours 36minutes 12seconds |
24minutes 53seconds 180millisec |
TM 12/01 24 06:10 |
TM 03/29 16:26:39 |
TM 10 22 05:52.92 |
| 12years 1months 24days 6hours 10minutes |
3months 29days 16hours 26minutes 39seconds |
10days 22hours 5minutes 52seconds 920millisec |
[ Elapsed Time Stamp ]
TMSP 005.398.614 |
| 5seconds 398milliseconds 614microseconds |
Idle time display is ideal for checking the response time and timeout of transmission or reception a a glance.
[ Idle Time Display ]
IDLE 02.78 |
IDLE 0.046 |
| 2.78seconds | 0seconds 046milliseconds |
Long Recording Time Allowing Rolling back to Points of Communications Failures
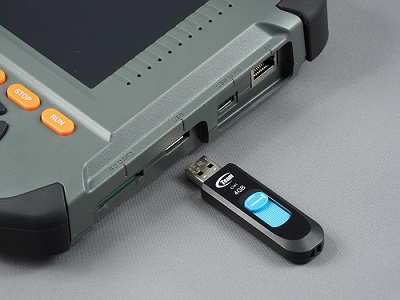
The analyzer has 1GB internal capture memory that gains high-speed access to megaspeed communications, and is provided with ring and fixed buffer modes. The user can select the ring buffer mode for endless recording or the fixed buffer mode to stop recording automatically when the memory is full. Furthermore, the LE-8200A incorporates an auto save function that makes it possible to save the monitored content of internal memory on a high-capacity external memory in a specified file size continuously. This is useful for identifying communication failures which occur at rare intervals.
| Speed | Continuous recording time reference*1 | ||
|---|---|---|---|
| Main memory only | 64GB USB memory*2*3 | 500GB SSD*2*3 | |
| 9600bps | Approximately 60 hours | Approximately 152 days | Approximately 1203 days |
| 115.2Kbps | Approximately 5 hours | Approximately 312 hours | Approximately 40 days |
| 1Mbps | Approximately 36 minutes | Approximately 40 hours | Approximately 13 days |
Does not guarantee the operation of all USB memory and USB connected SSDs.
[ USB storage connection image ]
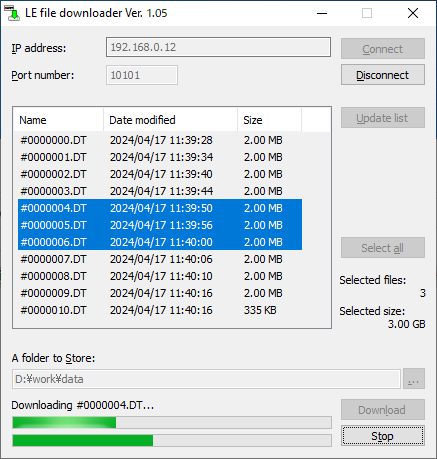
Communication log files can be imported to a PC while measurement.
Using "LE File Downloader lefiledownload (V1.04 or later)", you can import the communication log files saved in the storage device with the auto save function to your PC via LAN or Wi-Fi. Execute the auto-save on the analyzer set at the site, import the communication log file with the time stamp around the time when the communication failure occurred into the PC, and then you can analyze it with the PC link software.
Supporting Logic Analyzer Analysis and Analog Waveform Analysis
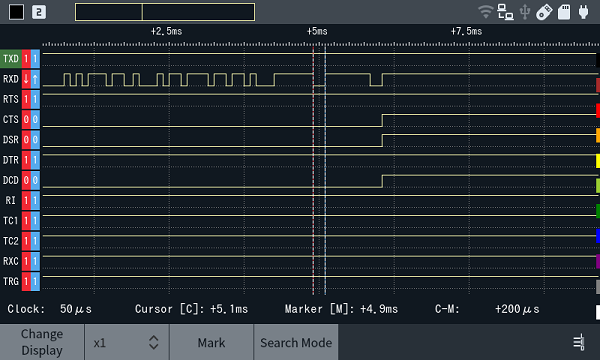
The logic analyzer function, which displays communication line timing in digital waveforms, offers a sampling of up to 200MHz. 12 lines can be displayed at the same time using the large screen, and the time between two points can be easily measured by operating the time cursor. In addition, the PULSGEN waveform output mode allows you to edit and reproduce measured waveform data on the screen. You can use it not only for waveform observation but also for timing margin confirmation tests.
Logic Analyzer Function
○ Time measurement between two points
Move cursor C (dotted blue line) to the first signal position with [[▶] and [[◀] and tap [ENTER] or "Mark" to mark that position as marker M (dotted red line). Next, move cursor C (dotted blue line) to the time measurement point with [[▶] and [[◀], and the time between cursor C and marker M will be displayed in "e;C-M:"e; on the bottom line of the screen.
○ Change display order of signal lines
You can use [▲] and [▼] to select the signal whose display order you want to move, and use [SHIFT] + [▲] and [SHIFT] + [▼] to change the display order of the selected signal.
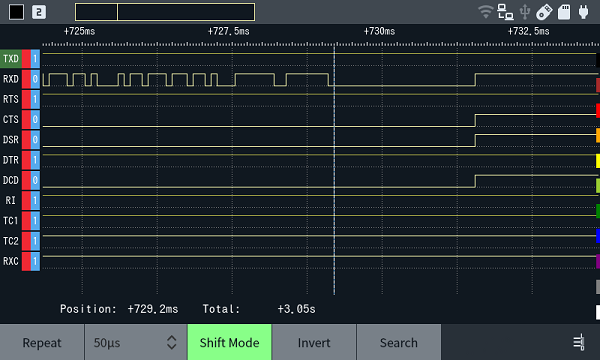
Edited Waveform Output (PULSGEN function)
It can output edited waveform data measured by logic analyzer function. It is useful for having error finding tests at various timing.
Select the signal to be edited (green background color) with [▲] and [▼], and move the cursor with [▶] and [◀].
If you select "Shift Mode" and press [▶], you can insert a signal with the same signal level as the cursor position to the right for one timing time.
Select "Shift Mode" and press [◀] to remove the signal on the right of the cursor position by one timing time.
Tap "Invert" to invert all signal levels on the right of the cursor position.
Simulation function that enables flexible communication tests
The simulation function provides a transmission/reception test environment according to the development phase by making the analyzer act as a communication partner. There are many test modes that are indispensable when the communication partner device cannot be prepared in the early stages of development.
Transmission data table
The transmission data used for the test can be registered in advance in HEX, or typed on the full keyboard screen. You can use the function to register only the specified data as a parity error and automatically calculate CRC and BCC.
SD/RD side distribution function for half-duplex communication data
During a half-duplex communication test that uses only the SD line like RS-485, the test can be performed while the transmission data of the analyzer is distributed to the SD side and the response data from the other device is distributed to the RD side for real-time monitor recording.
Driver control during RS-485 half-duplex communication test
During simulation, the output of the RS-485 driver IC can be linked to data transmission, always active, or the timing can be controlled by the program mode.
MANUAL mode
Arbitrary data registered in the transmission table corresponding to each key is transmitted each time the key is pressed, and the response of the other device is manually tested step by step while checking the response on the screen.
BUFFER mode
The data on the transmitting side or the receiving side captured in the memory by the monitor function is transmitted as it is as simulation data.
FLOW mode
You can test making the deveice as the sender or receiver of X-on/off and RTS/CTS flow control for ASYNC communication.
ECHO mode
The received data is looped back inside the unit and transmitted .
POLLING mode
You can simulate the slave side or master side in the polling communication procedure of multi-drop (1:N connection).
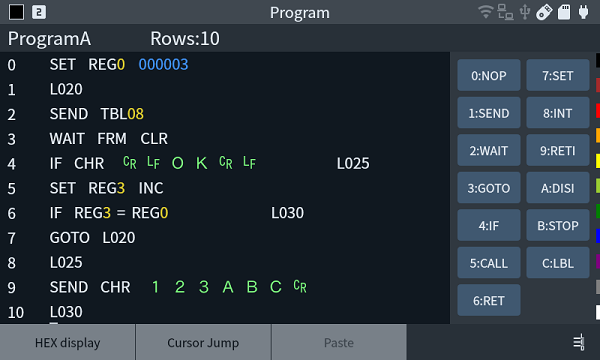
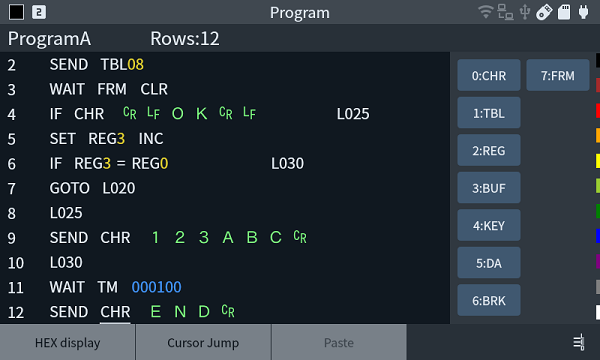
PROGRAM mode
By creating a program with a dedicated command, you can flexibly simulate a communication protocol that involves condition judgment.
[ Program Example ]
Register S, T, A, R ,T, CR, LF in transmission data table 08 in advance
000: Set value 3 to register 0
001: Label 020
002: Transmit contents of transmission data table 08
003: Wait for new received frame
004: If "CR, LF, O, K, CR, LF" is received, branch to label 025
005: +1 to register 3
006: If the values of register 3 and register 0 are the same, branch to label 030
007: branch to label 020
008: Label 025
009: Send "1, 2, 3, A, B, C, CR"
010: Label 030
011: 100ms wait
012: Send "E, N, D, CR"
>> Dedicated command list is here.
>> Other program examples are here.
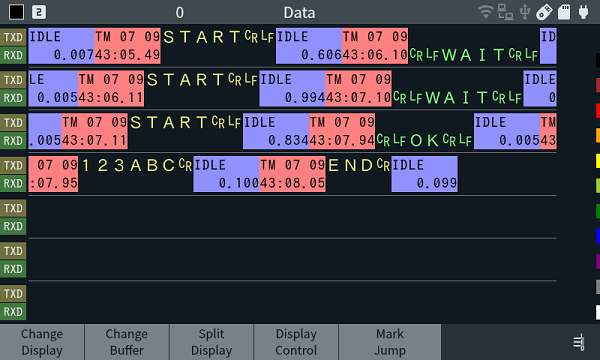
[ Example of PROGRAM execution screen (when OK is received for the third time) ]
PULSGEN mode
In this mode, you can edit the timing waveform data of the communication line measured by the logic analyzer function on the screen and transmit it. You can reproduce and test communication data with slightly different timings.
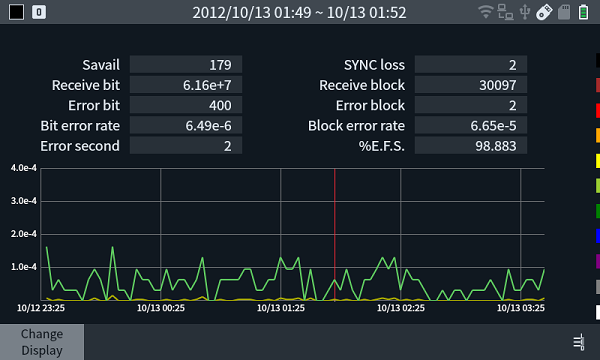
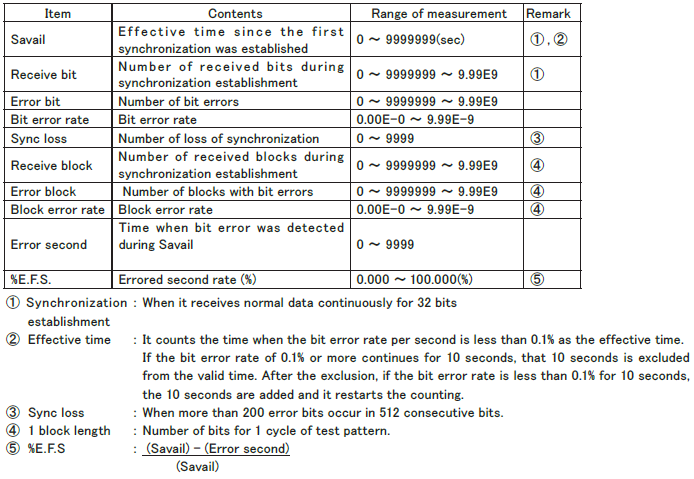
BERT (Bit Error Late Test) function useful for transmission quality analysis
It sends a transmission test pattern at a maximum of 5 Mbps, evaluates the returned data using parameters (bit error count, block error count) compliant with ITU-T G.821 standard, and can measure error rates and specify fault points.
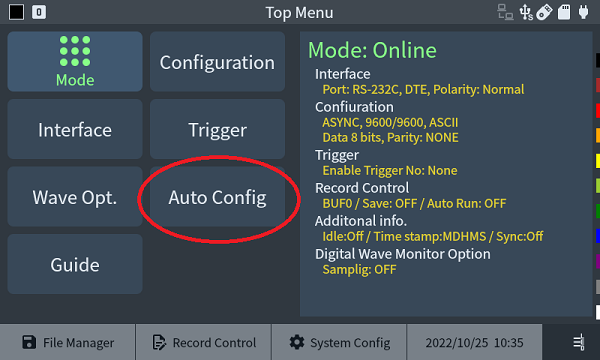
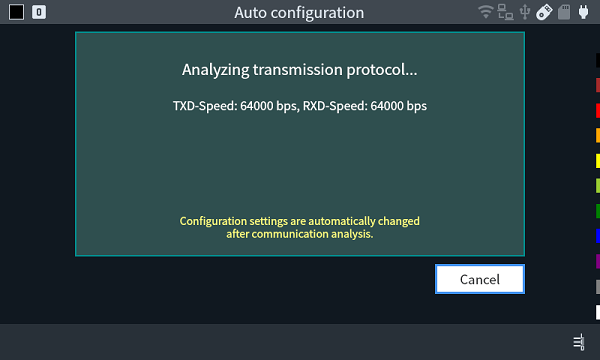
Auto configuration function to improve measurement efficiency
It receives communication data and automatically sets basic measurement conditions such as communication speed, character framing, data code, synchronization character, BCC/FCS, etc.
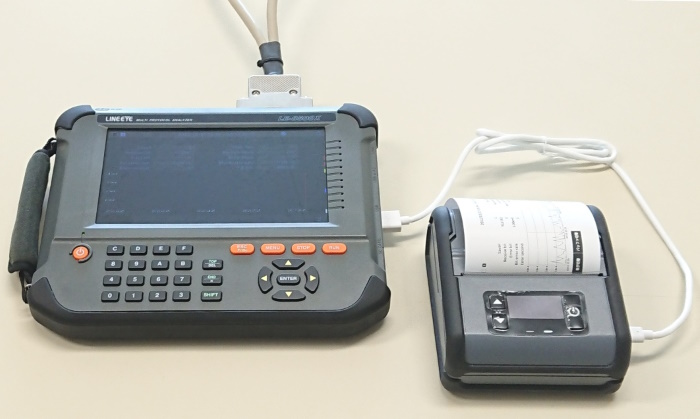
Save and print measurement reports in snapshot or text format
By pressing [SHIFT]+[ESC], you can take a screenshot of the screen display image of measurement results and setting conditions and save it as a PNG file. The measurement data can be converted to a text format file and saved on a storage device, which is useful for creating a report of the test results. In addition, by connecting a dedicated printer*, it can continuously print out a specified range of measurement data and print a hard copy of the screen display image, which can be used as a recording memo on site.
Note: PC link software is required to save the measurement data in text format.
・Monitor data
・Monitor data with line state
・Monitor frame translation data
・BERT data (txt)
・BERT data (csv)
[ Hard copy printing usage image ]
File management function
File management function It has the file management function that allows you to save, read, and delete measurement data, setting data, and screen shots in external storage such as a USB memory or SDHC card. Screenshots (and text data) can be viewed on the analyzer.
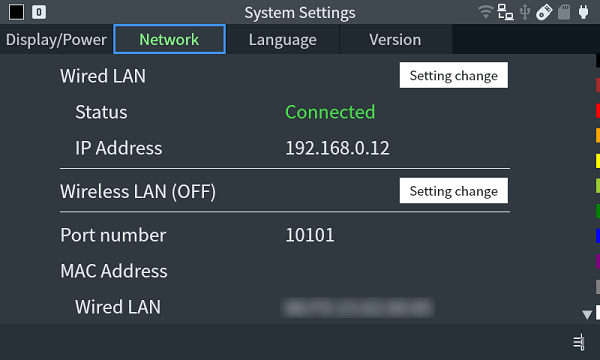
Transfer measurement data to PC via Ethernet, USB, or Wi-Fi (XR only) connection
High-speed data transfer via G-bit Ethernet or USB 3.0 is supported for remote connection and data transfer to a PC. The Wi-Fi compatible model LE-8500XR-RT can connect to a PC via Wi-Fi.
The PC link software "LE-PC800X" has a light version to check its functions.