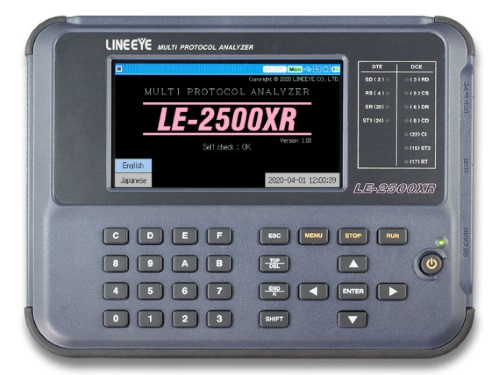
LE-2500XR
●4.3 inch color touch screen
●RS-232C, RS-422/485, TTL (UART/I2C/SPI) as standard
●Supports HDLC/SDLC, I2C, and SPI measurement tests as standard
●Supports CAN, CAN FD, LIN, CXPI etc. by optional expansion set
●Secure long-term recording on USB flash or SD card by AUTO SAVE
●High precision time stamp of hour, minute, second, 10msec
●Logic analyzer analysis and signal voltage measurement
●Supports PC connection and remote control by Wi-Fi
LE-2500XR: Japanese model (with Japanese manual)
LE-2500XR-E: Abroad model (with English manual)
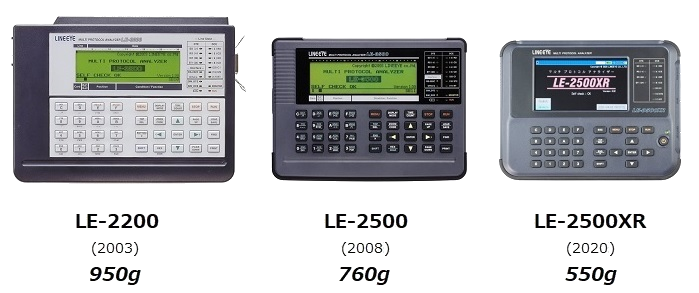
The LE-2500XR is a standard model of a stand-alone communication protocol analyzer which has a touch panel color display and adopted lithium ion battery while inheriting all the functions of the conventional model LE-2500/LE-2500R which have the monitor function, simulation function, and bit error rate test function necessary for communication analysis test.
Visualization of signal status and error data on the line monitor display is dramatically improved by colorizing the display. With the touch panel and the physical key switch, you can optimize the use of them - for example, swiping of the touch screen for display of a large amount of communication monitor data and key operation for MANUAL simulation mode (in which communication test data are assigned to the keys and transmission/reception test is executed). In addition, many key operations of the conventional model are inherited as shortcut key operations.
The newly designed housing is significantly smaller and lighter than the conventional model, reducing the burden for maintenance of communication device and trouble shooting of communication systems.
LE-2500XR is a high cost performance product which can be widely used for RS-232C serial communication around PCs, trouble analysis of RS-422/RS-485 lines of FA equipment, embedded development of I2C, SPI and UART devices, and in-vehicle communication test of CAN, LIN etc.


Smaller and lighter keeping the full function of the communication analysis functions
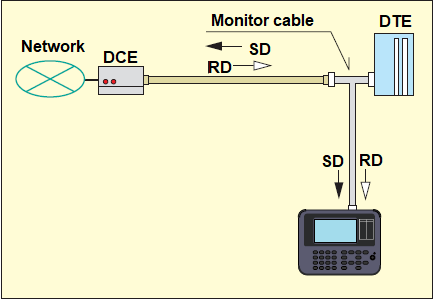
This model is smaller and ligheter than the conventional models while fully equipped with the online monitor function which records and displays communication data without affecting the communication line, the simulation function which performs transmit/receive test as a communication partner, and the bit error rate test (BERT) function.
Equipped with a color LCD display
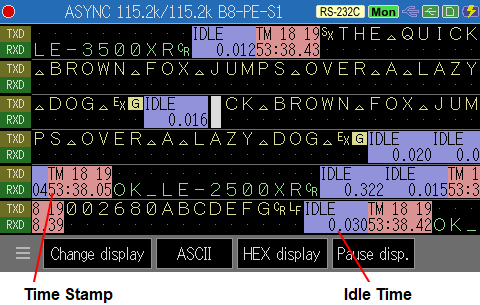
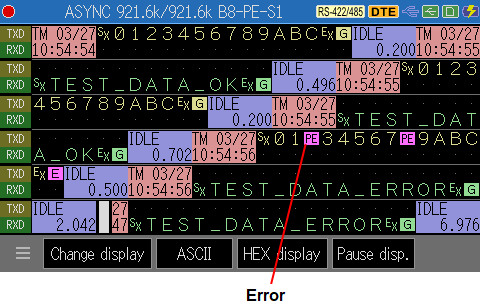
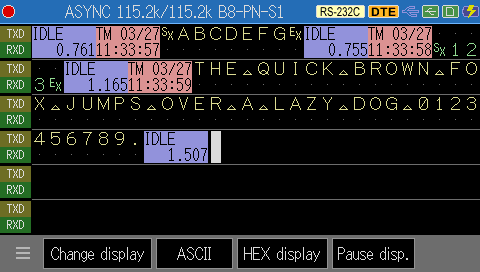
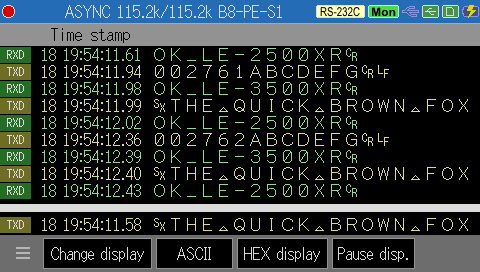
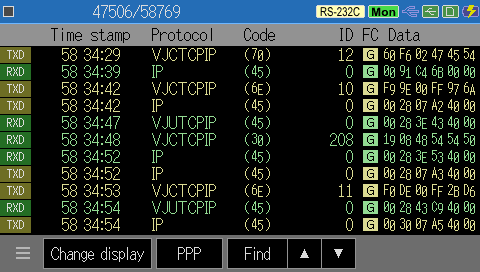
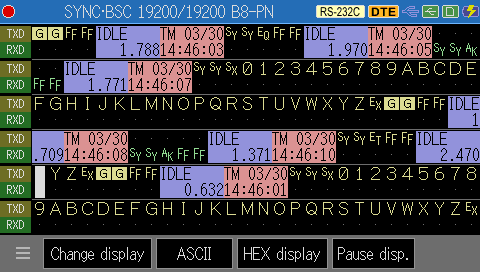
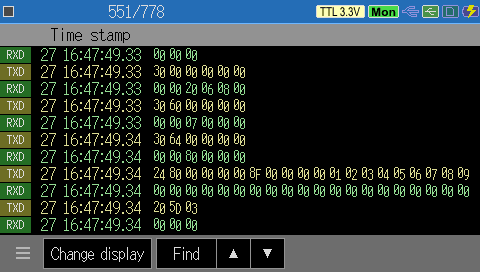
This model has a 4.3-inch color touch display with a wide viewing angle. The communication data which can be displayed on one screen has increased compared to the conventional model, and the color monitor makes the line monitor display easier to see. In particular, the visibility of the line state signal display and error data display has dramatically improved.
<Monitor example of normal data>
<Monitor example of data with errors>
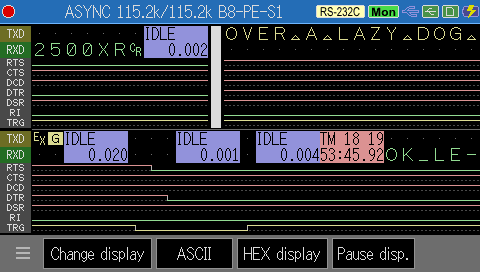
<Line state display>
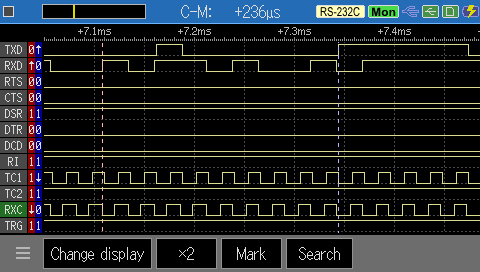
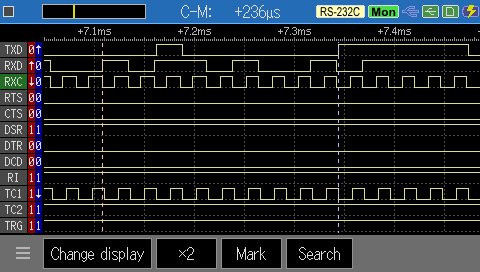
<Logic analyzer display>
Time Stamp Display
Date/time unit "year/month/day hour:minute", "month/day hour:minute:second", "day hour:minute:second.10msec", etc. can be specified.
Idle Time Display
Time resolution 100msec, 10msec, 1msec can be specified
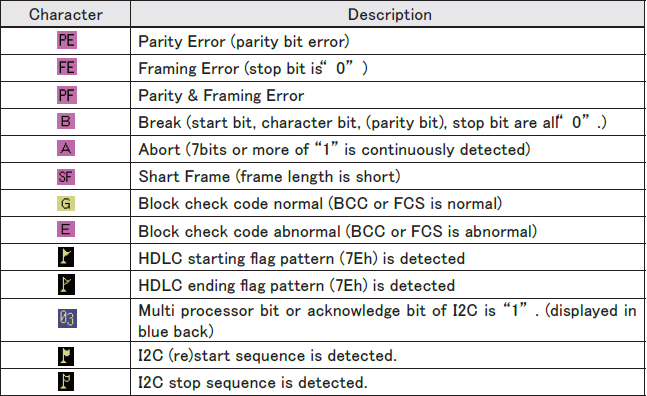
Error and Specific Data Display
Hybrid operation of capacitive touch panel and physical key switch
The capacitive touch panel offers intuitive touch selection and swipe operations like a smartphone. it supports key switch operation for when wearing gloves. The key operation similar to the conventional model is inherited as the shortcut key operation
Swipe to scroll monitored communciation data up/down/left/right
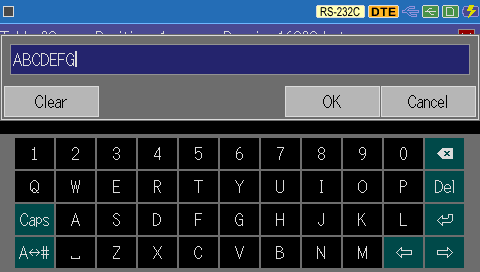
Efficient text input by using the full keyboard displayed on the screen
Shortcut keys example
[MENU] and [0] Configuration display
[MENU] and [2] Trigger display
[MENU] and [4] Waveform monitor setting
[MENU] and [9] Data table selection display
Key operation is useful for some functions
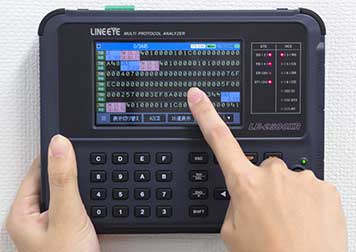
In the MANUAL simulation mode, in which communication test data is assigned to the keys and the communication response of the device under test is checked on the screen while the test data is sent by key operation, the key operations is useful as the monitor display screen can be widely used.
<Example of LE-2500XR>
<Example of LE-110SA>
Supports multiple communication protocols and interfaces
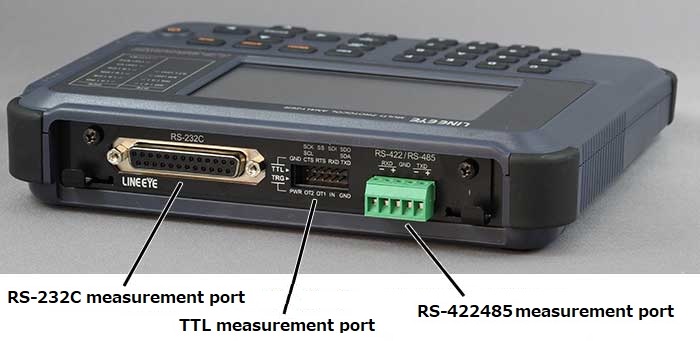
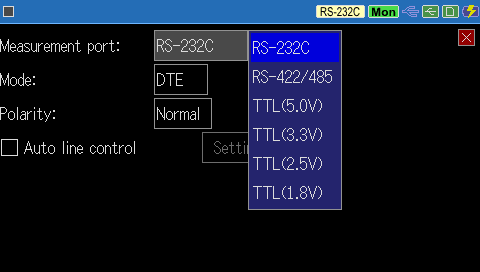
This model supports measurement of RS-232C, RS-422/485, and TTL (1.8V-5V system) signal level UART communication, I2C, and SPI. A wide range of options are available to extend the measurement function to legacy ports such as X.20/21 and V.35, current loop communication, and in-vehicle communication such as CAN, CAN FD, LIN, and CXPI.
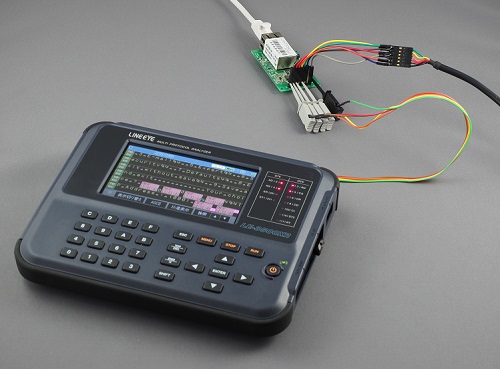
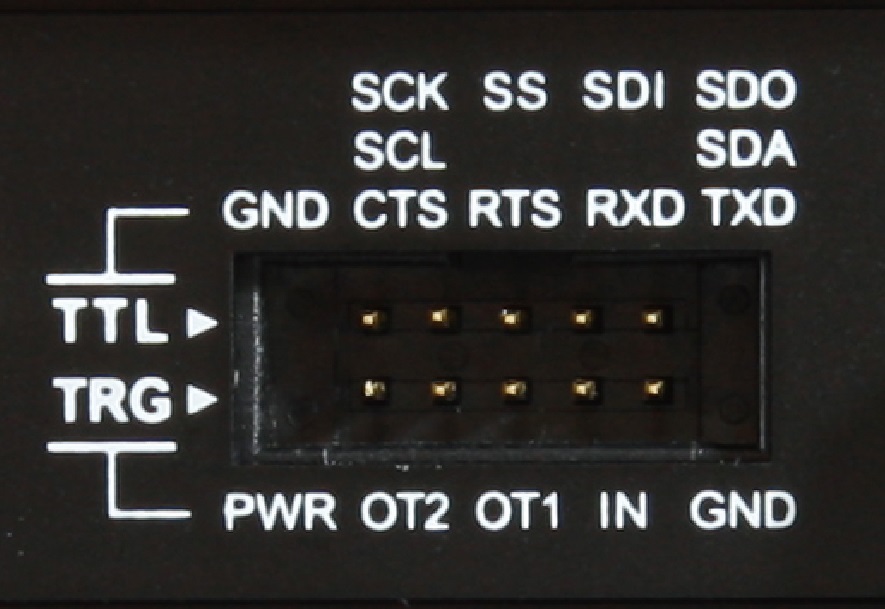
The TTL measurement port supports external trigger input/output
This external trigger input/output terminal can be used for 1.8V/2.5V/3.3V/5V signal level UART communication, I2C, SPI measurement and measurement linked with an external measuring instrument.
<Usage image>
<Example of LE-110SA>
<TTL measurement port>
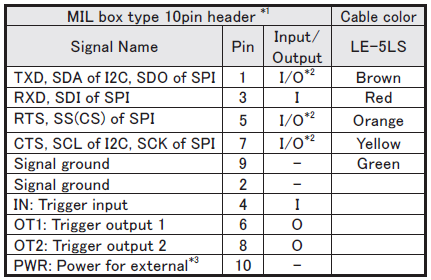
*1: 2.54mm pitch, HIF3FC-10PA-2.54DS(71) Hirose Electric equivalent
*2: Output during simulation, but SS and SCK are input during SPI slave
*3: Output the specified voltage of TTL port during simulation (maximum 30mA)
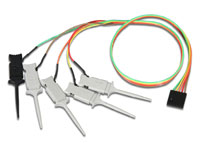
It can be used for connection of TTL communication signals and external trigger signals.
If you use both at the same time, please purchase extra.
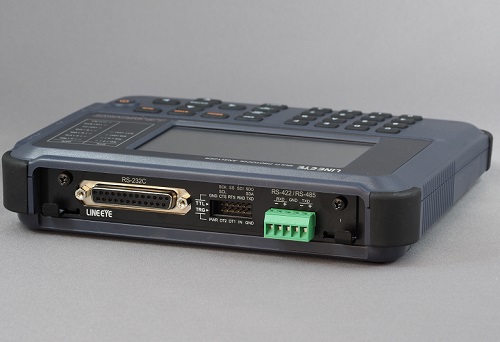
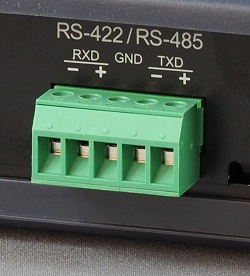
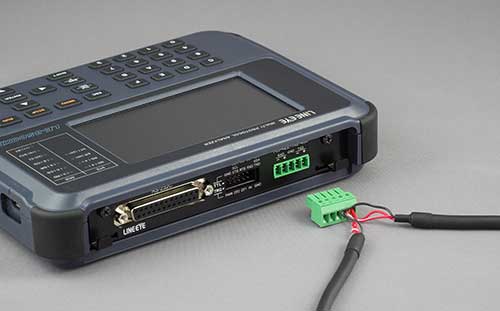
The RS-422/485 measurement port is removable terminal block
The RS-422/485 cable can be directly connected to the port. When you temporarily need to disconnect the analyzer from the monitor line, you do not need to screw off the cable, you just need to detach the terminal.
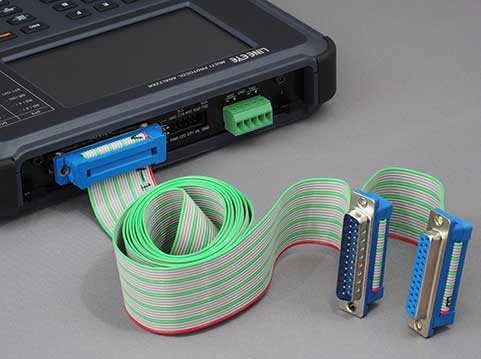
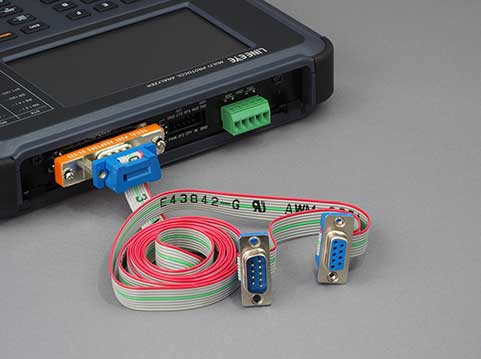
Supports DSUB 9-pin and DSUB 25-pin of RS-232C as standard
The RS-232C measurement port adopts the DSUB25 pin where the transmission/reception synchronization clock signal is arranged. As the produt includes a DSUB 25-pin monitor cable, DSUB 25-pin to 9-pin conversion adapter, and DSUB 9-pin monitor cable, it can be connected to both DSUB 25-pin and DSUB 9-pin of a RS-232C device.
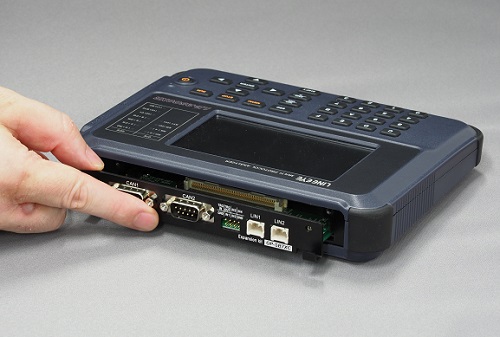
■Expansion kits offers more possibilities.
The communication standards with different hardware specifications can be supported by using the measurement board or an optional cable.
In addition, expansion firmware is also available that accelerates the maximum measurement speed of HDLC and SPI to half-duplex 10 Mbps and full-duplex 5 Mbps.
| Target | Model | Photo |
|---|---|---|
| CAN FD/CAN/CXPI | OP-SB7XC | 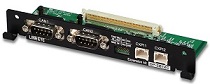 |
| CAN FD/CAN/LIN | OP-SB7XL | 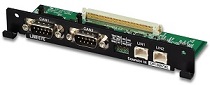 |
| Current Loop Comm. | OP-SB1C | 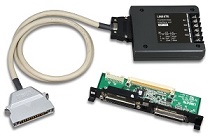 |
| USART (TTL Synchronous Comm.) | OP-SB5GL | 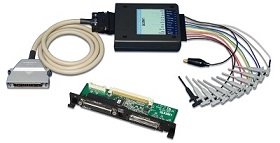 |
| RS-530 | OP-SB10N | 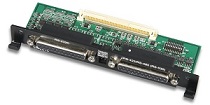 |
| X.20/21 | OP-SB10N and LE-25Y15 | 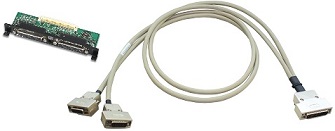 |
| RS-449 | OP-SB10N and LE-25Y37 | 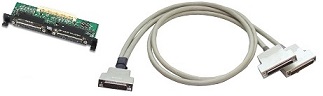 |
| V.35 | OP-SB10N and LE-25M34 | 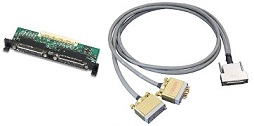 |
Various line monitor displays according to the communication protocol
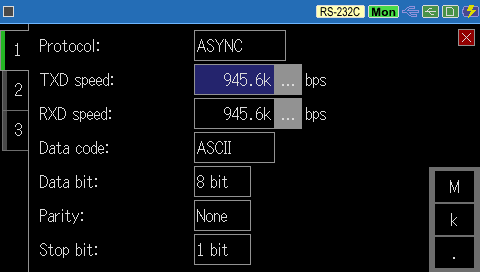
Flexible support for ASYNC asynchronous communication from legacy to present
It can monitor asynchronous communciation in which one data consists of a start bit, data bits (5 to 8 bits), parity bit (none, odd number, even, mark, space, or multiprocessor bit definition MP), and stop bit (1, 2 bits).
The MSB first transfer of the legacy protocol can be selected, and the suppress (removal) of the flag character is supported by the ASYNC-PPP protocol.
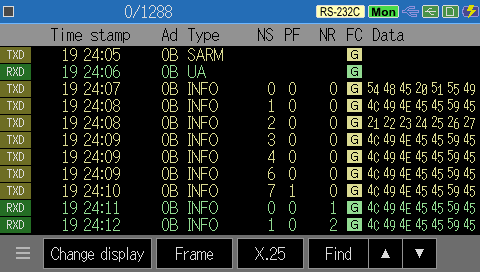
Bit synchronous communication such as character synchronous communication and HDLC
BSC communication synchronized with the SYNC character and HDLC/SDLC synchronized with the flag bit can be measured. It supports BCC/FCS (block check code/frame check sequence) judgment and HDLC address filters. NRZ, NRZI, FM0, FM1 data modulation formats can be selected.
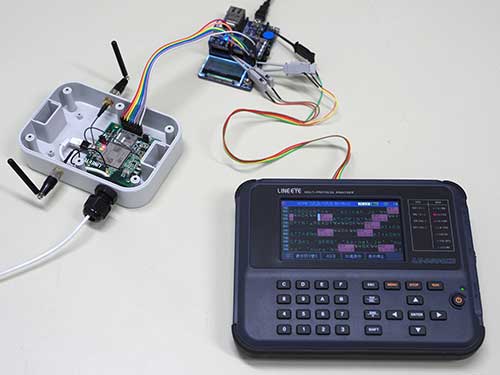
You can easily monitor SPI and I2C of TTL level communication
You can easily monitor I2C and SPI communication used in sensor modules, AD conversion ICs, memory ICs, etc. Also, transmission/reception tests can be performed on the master side or slave side.
<I2C monitoring example>
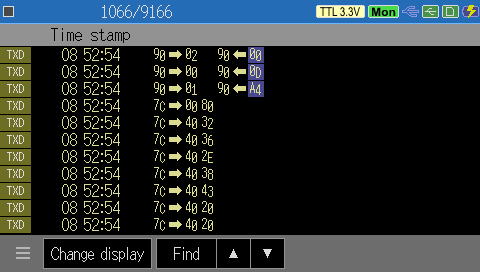
<SPI monitoring example>
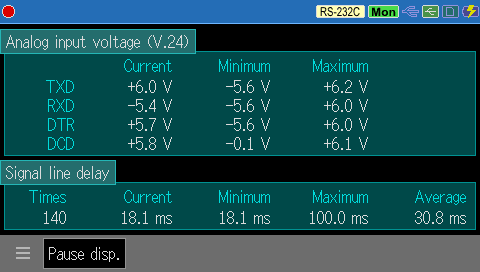
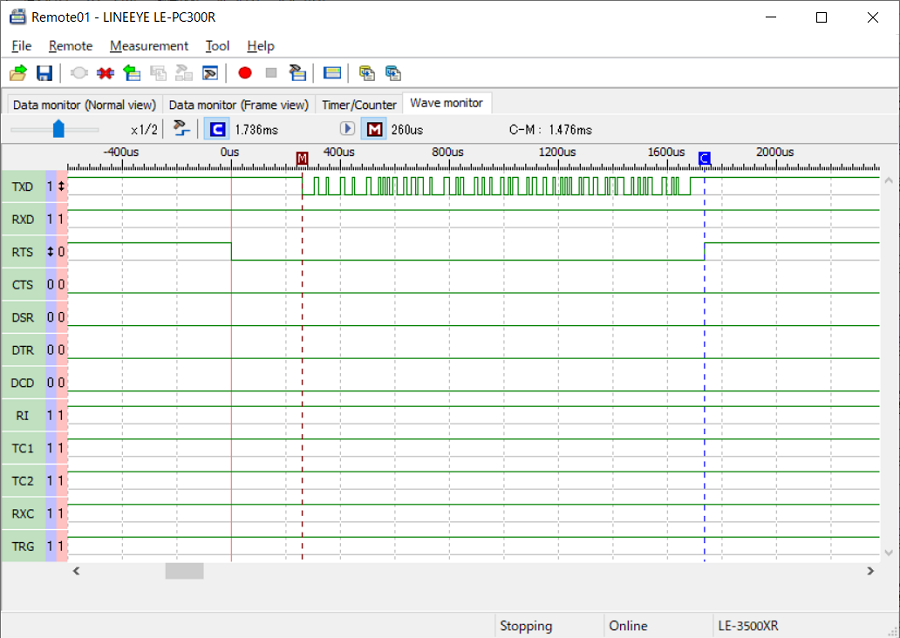
Logic analyzer function and signal voltage measurement function
The analzyer has a logic analyzer function which can measure the timing of communication lines with a time resolution of up to 50 nsec. It also has a function to measure RS-232C signals and TTL voltage amplitude which are difficult for testers to hit.
<Timing waveform wxample (logic analyzer display)>
<RS-232C signal voltage display example>
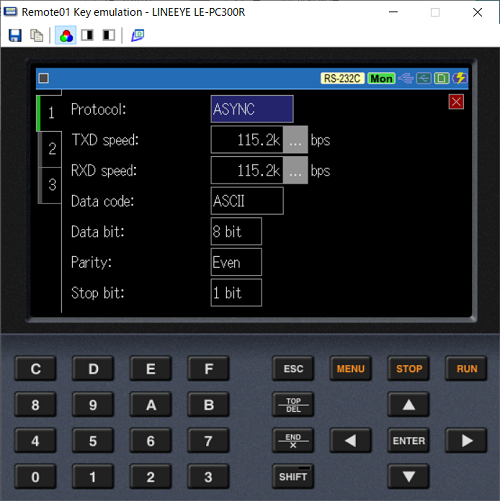
Mega-speed measurement, arbitrary speed can be set with 4 significant figures
It supports half-duplex/full-duplex line monitors up to 2.048 Mbps, simulation transmission test, and BERT measurement. As it has a high-precision DPLL circuit, you can set any communication speed (baud rate) of 50 bps to 2.048 Mbps separately for transmission and reception with 4 significant digits. Therefore, it is possible to support devices with special communication speeds, and it is also possible to intentionally send test data with slightly different communication speeds from this analyzer to evaluate the speed margin of the device under test.
<Communication speed setting>
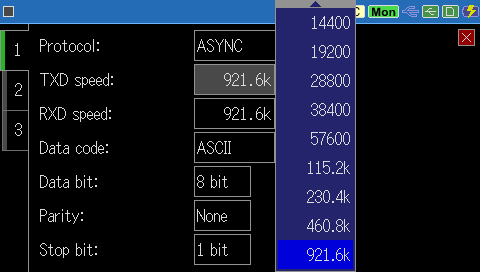
<Arbitrary speed setting>
Long time recording by AUTO SAVE function
By using the auto save function, you can save communication data to SDHC card or USB memory continuously for a long time. As the data is saved in multiple log files of the specified size (#nnnnnnn.DT: n is a sequential number in the order of saving), you can narrow down the communication logs of before and after the failure from the time stamp of the file in the time zone when the communication failure occurred.
Safely records measured communication files even if the battery runs out suddenly
In the conventional model, if the power is turned off while recording the communication log file, the file may be damaged and communication data cannot be analyzed. With this model, even if the internal battery is exhausted after a bus power failure, the communication status up to that point can be safely saved in a file.
| Target Line Speed (bps)*1 | |||
|---|---|---|---|
| Main memory only | Using 8GB external memory*2 | Using 32GB external memory*2 | |
| 9600bps | Approx. 6hrs. | Approx. 20days | Approx. 80days |
| 115.2Kbps | Approx. 28min. | Approx. 37hrs. | Approx. 6.5days |
| 1Mbps | Approx. 200sec. | Approx. 5hrs. | Approx. 20hrs. |
| Saving the captured data to USB flash or SD card | External memory up to 32GB |
|---|---|
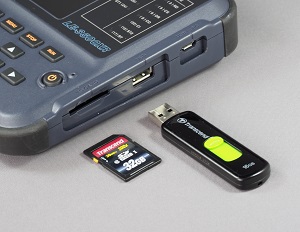 |
Supports optional SD card (such as SD-32GX) or USB flash |
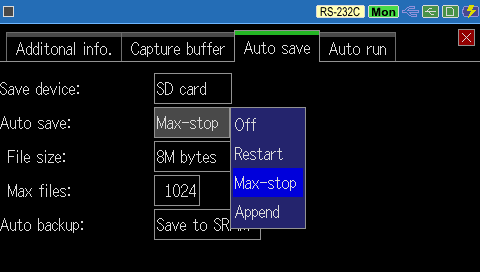
Added a mode to prevent overwriting of communication log files
Besides the Restart mode - the communication log files are recorded up to the specified number of files, the communication log file with the smallest file number is deleted and the communication data is endlessly recorded in a new communication log file - and the Append mode - measurement starts from the continuation of the existing communication log file -, the MAX stop mode - automatically stops the measurement after recording the specified number of communication log files - has been added.
<Auto Save setting screen>
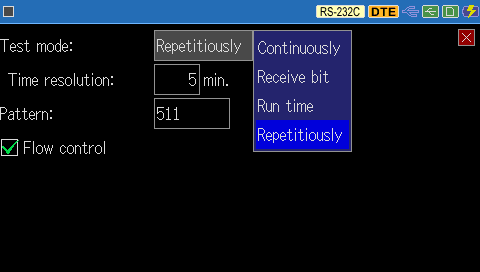
AUTO RUN automatic measurement function - convenient for unattended measurement
It can automatically execute a measurement for the specified period by specifying the date and time of measurement start and end.
<Auto RUN setting screen>
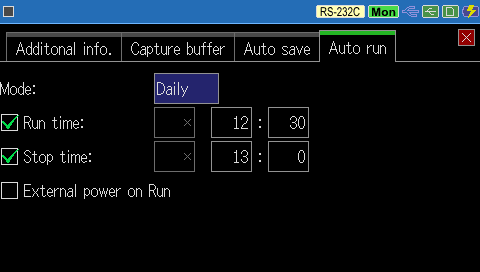
With the settings on this screen, measurement starts every day at 12:30 and automatically ends at 13:00.
4 modes of simulation function
The analyzer has 4-mode simulation function in which it performs transmission and reception tests as a communication partner of the device under test.
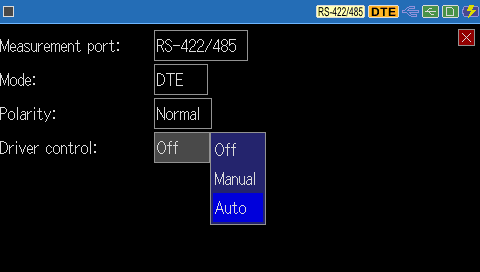
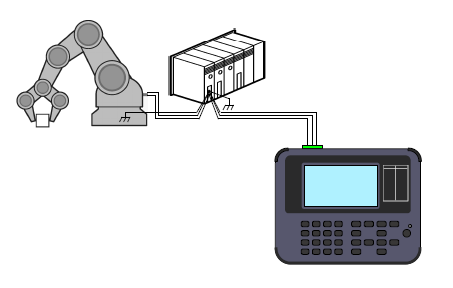
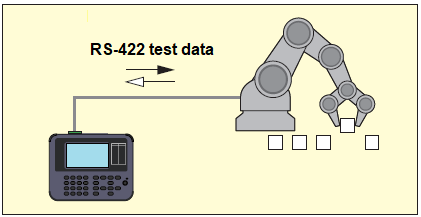
<Connection image of RS-422 simulation>
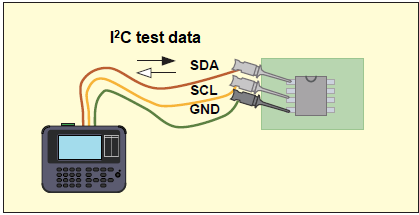
<Connection image of I2 simulation>
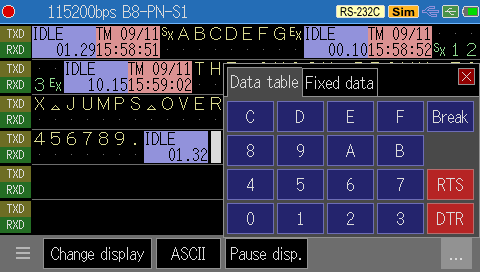
■ MANUAL mode
You can send the test data registered in the transmission data table of [0] to [F] of 10 groups by pressing the [0] to [F] keys. In this mode, you can easily test the communication procedure by key operation while on the monitor screen checking the response from the target device in development.
■FLOW mode
In this mode, flow control procedures such as X-on/off or RTS-CTS of asynchronous communication are simulated on the transmitting side or the receiving side. You can check whether the device under test is operating correctly in response to the transmission interruption request.
■ECHO mode
In this mode, the received data is returned inside the unit and returned. It can be used for a communication test with a terminal in echo back mode and as a BERT loopback point.
■POLLING mode
In this mode, the analyzer operates for simulation as a slave side or a master side in the multi-drop (1:N connection) polling communication procedure. You can test the procedure including error checking process without writing a program.
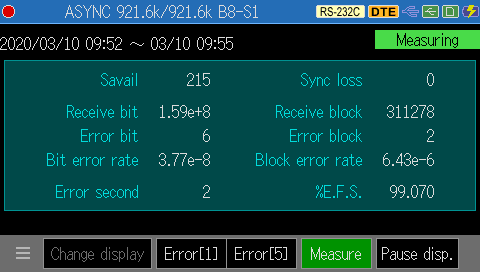
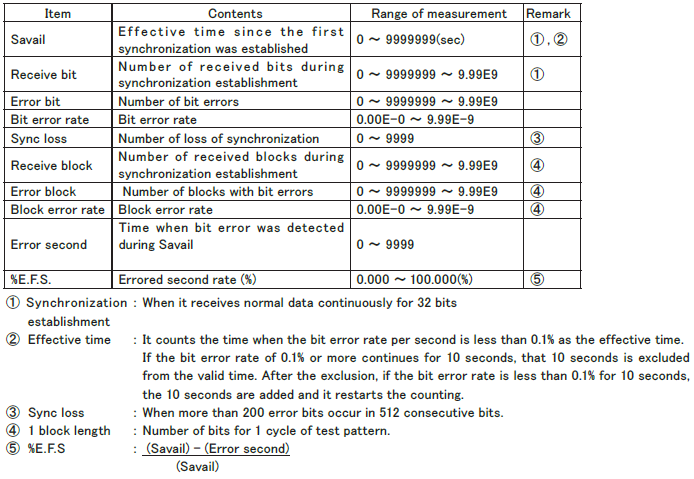
Equipped with BERT function comparable to a dedicated machine
It is equipped with a bit error rate test function that can measure the communication error rate with parameters compliant with ITU-T Recommendation G.821, and can evaluate the quality of the communication line and isolate fault points.
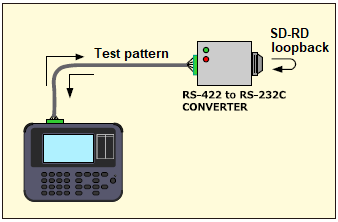
<Loopback test image>
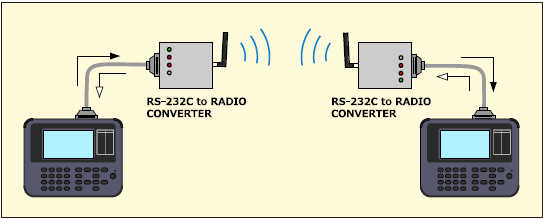
<Connection image of the opposite test>
<BERT setting>
<BERT execution>
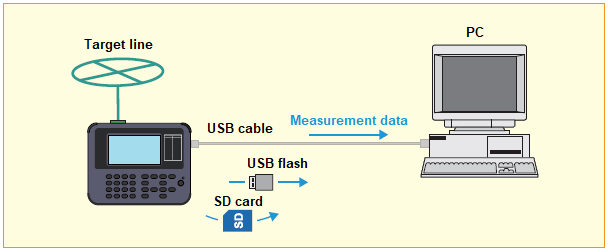
Full use of measurement data by PC connection
The PC link software is attached
By using the included PC link software LE-PC300R (light), you can utilize the measurement data on your PC.
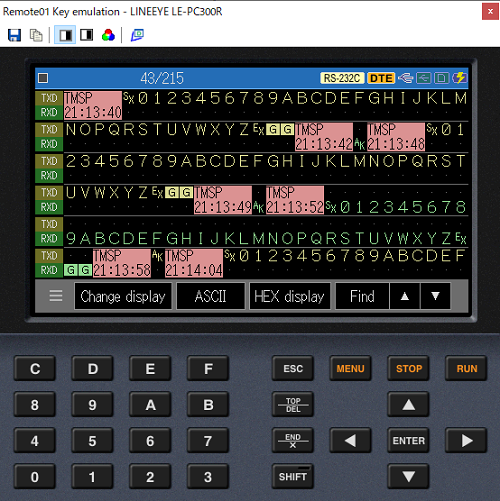
>> PC link software "LE-PC300R"
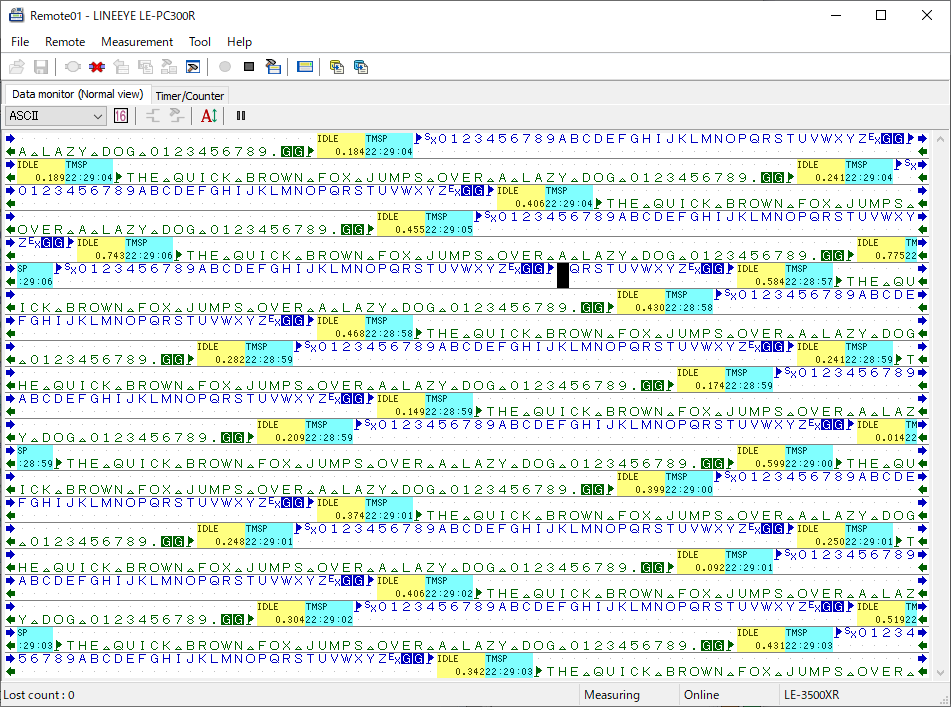
■ Offline data display/text conversion
By connecting an SDHC card or USB memory (in which measurement data files are saved) to a PC, you can open and display multiple data files on the PC at the same time or convert the file to .text / .CSV file. Of course, you can also analyze the data file sent by email from another department.
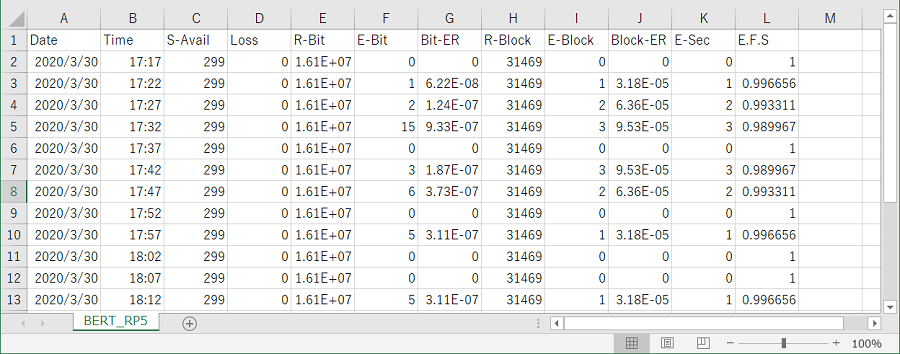
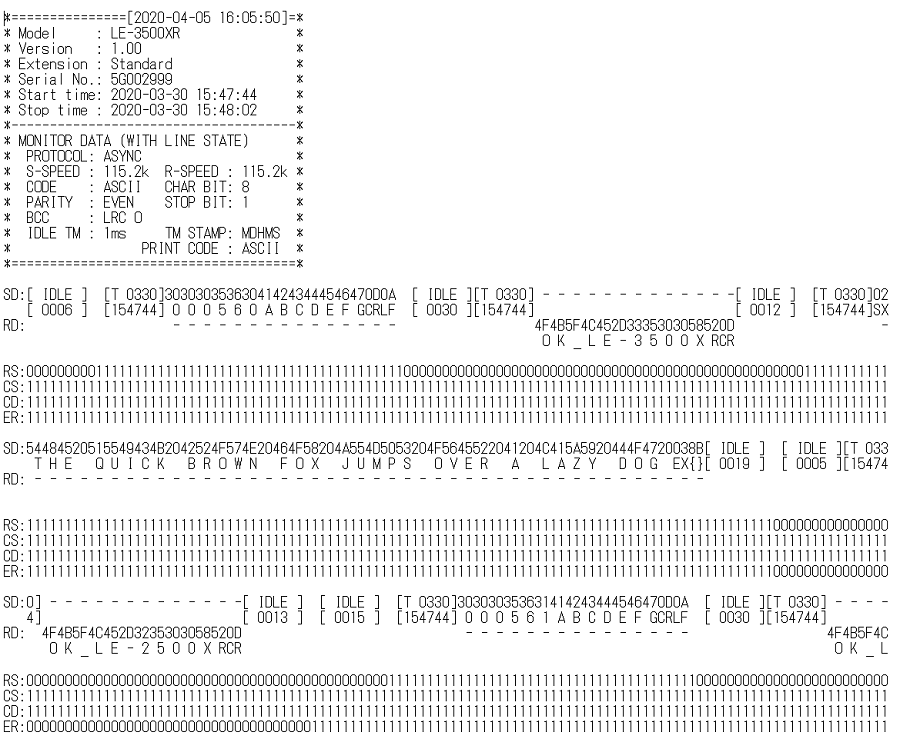
>> Text conversion example
>> CSV conversion example
■ Records measurement data on PC via remote connection
By connect the analyzer to a PC with USB or Wi-Fi, you can remotely control the communication analyzer from the PC or remotely monitor the measured data of the communication analyzer. When connecting via Wi-Fi, you can select the station mode (when connecting via an external Wi-Fi access point) or the access point mode (when connecting directly to tthe analyzer which acts as a W-Fi access point).
<Usage image in the station mode>
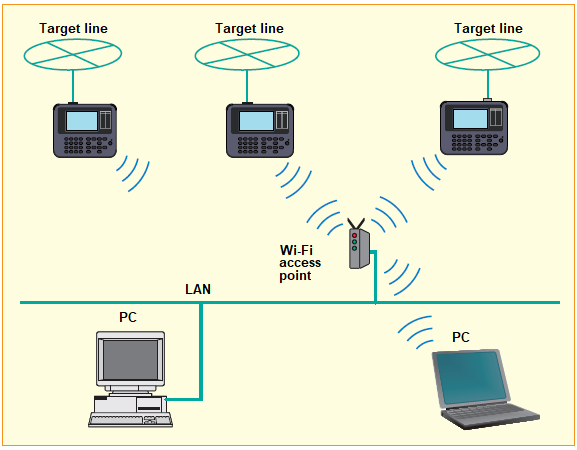
Multiple analyzers can be controlled at the same time from one PC to which the PC link software is installed. You can also access the analyzer from a desktop computer connected to an external Wi-Fi access point connected to the LAN.
<Usage image in the access point mode>
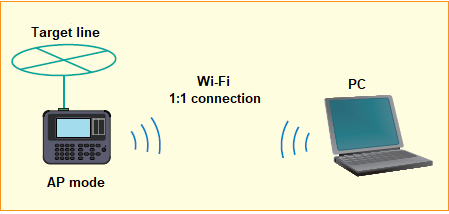
The computer and analyzer have a 1:1 connection, which is convenient when an external Wi-Fi access point cannot be used.
Obtain the communication log file while continuing measurement
By using the LE file downloader (lefiledownload.exe) which can be downloaded free of charge from the LINEEYE website, you can connect the analyzer and a PC via Wi-Fi and obtain the communication log file (saved in the storage device inserted to the analyzer) to the PC. The imported communication log file can be opened and displayed by PC link software for analysis.

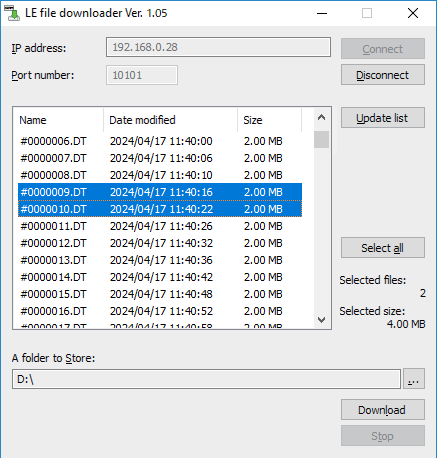
*: The communication log file in saveing process by the auto save function cannot be downloaded.
By using the LE file downloader (lefiledownload.exe) which can be downloaded free of charge from the LINEEYE website, you can connect the analyzer and a PC via Wi-Fi and obtain the communication log file (saved in the storage device inserted to the analyzer) to the PC. The imported communication log file can be opened and displayed by PC link software for analysis.
Firmware update
The latest firmware with new features and improvements will be posted on our website. If you download it to your computer, you can easily update it to the latest version via a USB cable.
The latest firmware with new features and improvements will be posted on our website. If you download it to your computer, you can easily update it to the latest version via a USB cable.
Full of functions to improve measurement efficiency
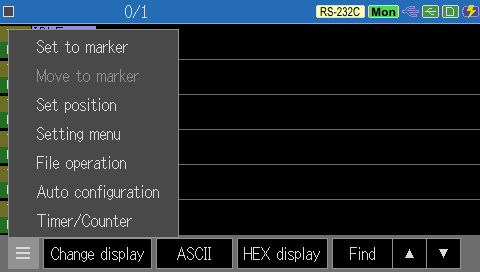
Auto Configuration Function
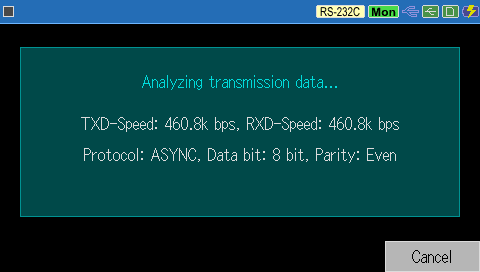
It analyzes the received communication data and can automatically sets basic measurement conditions such as communication speed, character framing, data code, synchronization character, BCC/FCS, etc.
<Auto configuration start setting>
<Auto configuration condition set display>
The trigger function supports an external trigger
Trigger function that can specify up to 4 sets of conditions such as transmission and reception of specific data and measurement action after the condition is satisfied. It is very useful for investigating an intermittent failures often found in communication systems. As you can spcify the meet of a trigger condition as the other trigger condition, you can analyze the complex event involving sequence-like condition determination. Using the external trigger input/output, you can use the analyzer in combination with external device contacts and external measuring instruments such as oscilloscopes for various situations.
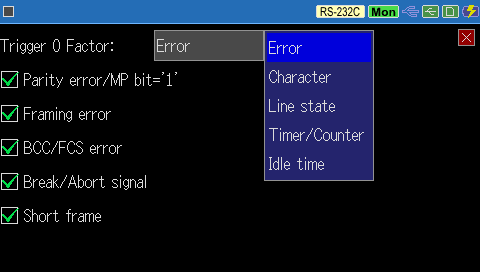
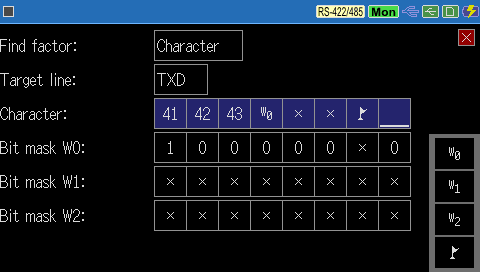
<Trigger condition setting>
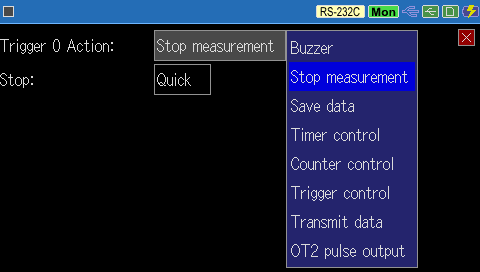
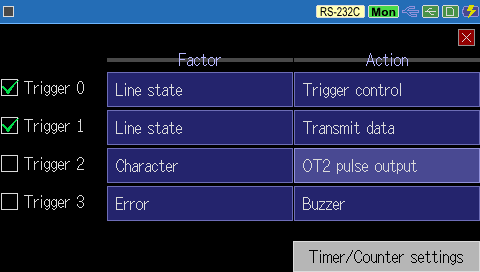
<Trigger action setting>
<Trigger setting summary display>
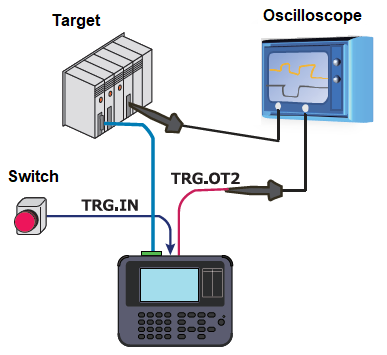
When the switch is turned on (external trigger input is L), the character string ABC is sent, and when the character string 123 is received as a response, the trigger signal (external trigger output 2) is supplied to the oscilloscope.
Trigger 0 and 1 are enabled, external trigger input 0 of line state is set for both factors, trigger 2 is enabled by trigger 0 action, and data transmission is set for trigger 1 action. Set the detection of the character string 123 to the trigger 2 factor and the OT2 pulse output to the trigger 2 action.
Set it to the simulation MANUAL mode and register the character string ABC in the send data table.
Offline analysis and data search
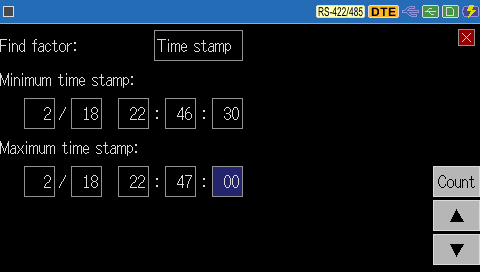
The measured data can be freely scrolled by swiping the screen. You can mark the data you want to read, scroll the display, and then return to the mark position with one touch. The powerful search function can display and count error data, specific character strings, time stamp data in a specified range, etc.
<Data string search setting example>
<Time stamp range setting example>
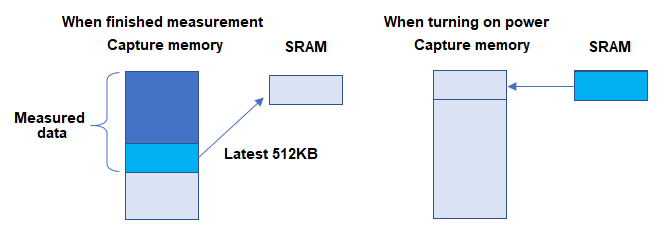
Auto backup function
In addition to 100 MB of capture memory, it has a built-in battery-backed SRAM area. At the end of measurement, the latest measurement data of approximately 512 Kbytes is automatically backed up in this SRAM area and automatically loaded to the capture memory when the power is turned on. This allows you to use it as if you were using an old model in which the measured data did not disappear when the power was turned off.
In addition to 100 MB of capture memory, it has a built-in battery-backed SRAM area. At the end of measurement, the latest measurement data of approximately 512 Kbytes is automatically backed up in this SRAM area and automatically loaded to the capture memory when the power is turned on. This allows you to use it as if you were using an old model in which the measured data did not disappear when the power was turned off.
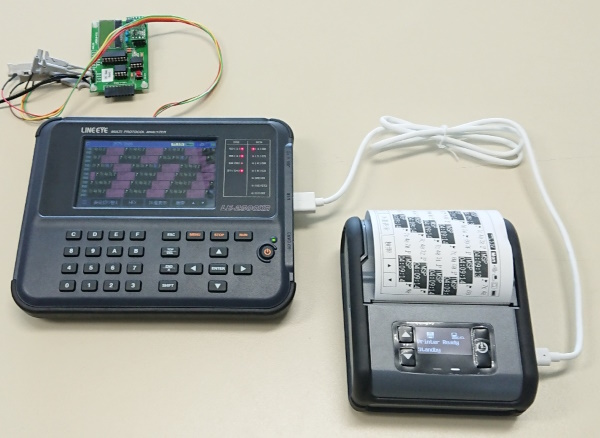
Save and print measurement reports in snapshot or text format
By pressing [SHIFT]+[ESC], you can take a screenshot of the screen display image of measurement results and setting conditions and save it as a PNG file. The measurement data can be converted to a text format file and saved on a storage device, which is useful for creating a report of the test results. In addition, by connecting a dedicated printer*, it can continuously print out a specified range of measurement data and print a hard copy of the screen display image, which can be used as a recording memo on site.
Note: PC link software is required to save the measurement data in text format.
・ASYNC
・SYNC frame
・HDLC line state
・X.25 packets
・PPP translation
・I2C translation
・Modbus translation
・SPI with OP-FW10XR
・BERT
[ Hard copy printing usage image ]
PC compatible file management
The analyzer setting data and measurement data can be saved in the SDHC card or USB memory as a FAT management format file compatible with a PC. Of course, since files can be used interchangeably between each model, you can use the measurement data saved by a LE-2500XR on site and analyze it in detail by the LE-3500XR in the development department.
<File magnagement display>
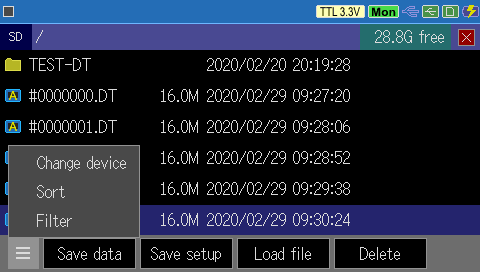
<File control display>
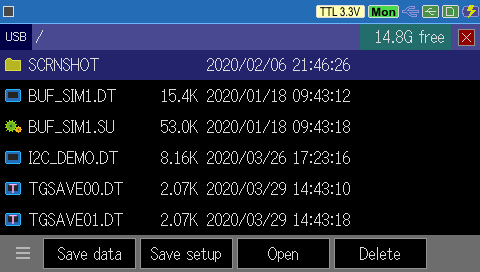
You can check the type, name, size, and creation date/time of the saved file by switching the storage device for file operation.
| File type | Measured data (.DT), Trigger save data (TG SAVEnn.DT), Auto save ata (#nnnnnnn.DT), Setting data (.SU) |
|---|---|
| File operation | Normal file display, filter display and sorting display by specified type, save, load, delete |
<File filter setting>
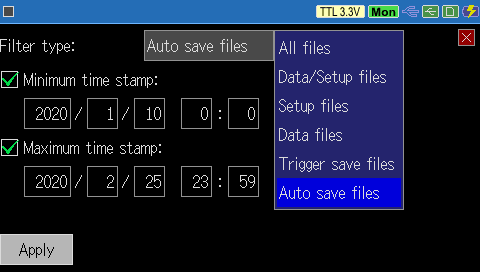
When many files are saved, you can specify the file type you want to display on the file operation screen at the file filter setting screen.
This screen shows the setting to display only the files automatically saved by the auto save function from 0:00 January 10, 2020 to 23:59 February 25, 2020.
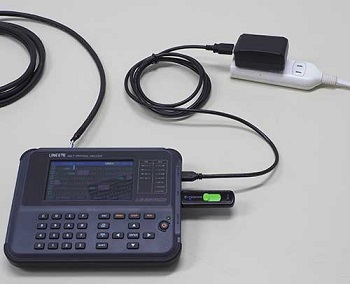
Bus-powered. Lithium ion battery is built-in.
You can power the analyzer by bus power from the micro USB connector and charge the built-in lithium-ion battery. The battery can be operated continuously for 7 hours, thus there is no need to worry even in places where AC power is difficult to use.
<When using battery charger>
<When using mobile battery>
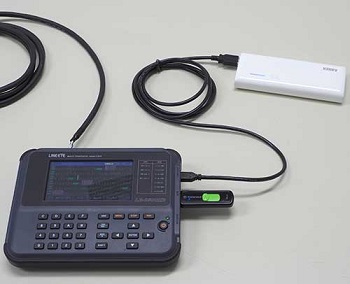
You can extend the battery life by using a commercially available 5V mobile battery.
(With a 13,000mAh mobile battery it can operate for more than 30 hours continuously)