| LE-610FS |
: |
Japanese model |
| LE-610FS-E |
: |
World wide model |
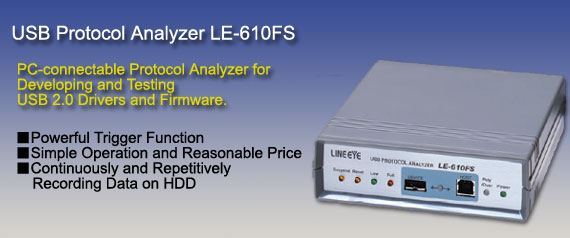
The LE-610FS is a USB protocol analyzer dedicatedly
designed for monitoring and used in connection with the PC through a USB
port. The model continuously records the details of USB 2.0/1.1 communication
on the hard disk of the PC in real time while displaying the details on
the monitor screen of the PC in an easy-to-understand fashion.
|
New version (Ver. 3.2.0.0) released. |
| |
For users using old version (Ver. 3.1.2.1 or before), download a new version from the support
page. |
Auto Tracking of High-speed USB Transmission
Without affecting the communication line carrying data between the analyzer and target devices, the LE-620HS and LE-610FS internally record large amounts of data and simultaneously transfer it to a connected PC via USB. The analyzers automatically detect the speed of the target devices (12/1.5 Mbps), so a speed setting is unnecessary. And if the device is connected through a hub of differing speed, measurement can be started by simply pressing the space bar of the PC. |
 |
(*1)PC for analysis
It is recommended to install the provided analysis software to a PC model incorporating a high-sped USB 2.0 port. If a full-speed USB port is used, however, data recording only to the built-in memory of the analyzer will be guaranteed. If the USB host used for measurement is a PC model supporting the operating conditions of the analyzer, the PC model can be used for analysis purposes as well.
(*2)USB cable
It is recommended to keep the length of each cable not exceeding the maximum limit specified for USB communication.
Continuous Repetitive Recording of Measurement Data on HDD
Measurement data captured by the analyzer is continuously transferred to the PC for analysis via USB port and recorded as a log file with a maximum of 2 GB on the hard disk of the PC. Furthermore, it is possible to form a ring buffer to record multiple log files continuously by using repetitive recording mode. The measurement log data can be displayed and scrolled during measurement, which is effective for an extended analysis of rare communication trouble under indefinite conditions.
Clearly Detailed Monitor Display
USB packets are clearly displayed by transaction. The LE-620HS can identify PING and the split transaction at high speed. Standard requests and descriptors are translated and displayed in detail, therefore the difficult-to-understand USB protocols can be intuitively understood. And, the LE-620HS supports a wide range of device-specific descriptors.
Note : The above screen is a display example of the LE-620HS. The LE-610FS is basically the same as the LE-620HS in display except the display of high-speed transfer, which is enabled by the LE-620HS only.
- Multiple packets are grouped and displayed on a single line by
transaction.
- Only the first 8 bytes of data packets are displayed. Clicking
the [+] mark displays all data.
- The selected transaction is highlighted with the operation of
the mouse.
- The USB state (i.e., the bus reset, suspend, or disconnection
state) is recorded and displayed along with communication data.
- The target transaction can be marked with 1 to 99, and can
jump to the marked positions.
- Displays the SOF (Start of Frame) frame number. At high speed,
microframes are displayed as (1/8) to (8/8). At low speed, nothing
is displayed in this column because no SOF packets are generated.
- Records and displays the time stamp at a resolution of 16.7
ns.
- Visibility of continuous NAK packets is improved by displaying
only those cycles.
- Displays the details of each transaction and frame.
| Token Packet |
type, name, PID, address/endpoint,
CRC5, packet head/tail time |
| Data Packet |
type, name, PID, payload, CRC16,
packet head/tail time. |
| Frame |
frame period, packet head/tail
time |
- Clicking the [>>] mark displays a detailed translation
window of the device request. Descriptors are displayed as a tree
view to show their hierarchical structure.
- When a device request item is selected for transaction, the
corresponding data in the
data packet is highlighted.
- Displays the content / meaning of device request.
- Displays the DATA packets in ASCII.
- Opens the device request window by clicking >> mark on the display.
The shape of tree shows the layerde stracture of a descriptor.
- Blinks the corresponding data in the data packet by selecting the item of the device request window.
Device Request Window
- Button for opening and closing the tree.
- Button for copying the contents of the Device Request/Descriptor to the clip board.
- Button for displaying the previous/next Device Request.
- Button for pinning the Device Request on the screen.
- Button for adjusting the depth of the color.
Highly Accurata Time Stamp Function
The built-in hardware timer of the analyzer records
the time stamps at the packet start and end at a
resolution of 16.7 ns based on the log start point as a
reference point*1. The time stamps are displayed in the
elapse time column and packet position bar. If the
cursor points the packet, the time stamps are displayed
on the tool tip window as well.
*1 The time stamp count
is reset to zero approximately five hours after the
start of the log and the time stamp count is
continued. |
 |
Real-time Filter
 |
The real-time filter reduces the quantity of log
file data and improves the efficiency of analysis. It is
possible to specify not to capture continuous NAK
response transaction such as IN-NAK and OUT-NAK. And can
specify particular addresses and end points under AND
condition in order to record only transactions which
meet the condition, or to eliminate them from the
targets of recording. |
Powerful Sequential Trigger
| It is possible to specify up to
16 trigger conditions (e.g., trigger conditions of
particular transfer data and external signal conditions)
in combination with actions to be taken at the time the
conditions are satisfied, and execute the actions in
sequence. Furthermore, this feature enables logging
control in synchronization with external signals and
linking with other measuring instruments by turning an
external trigger signal on detection of particular data,
thus making significant improvement in the efficiency of
program development. |
[ Packet trigger setting example 1
]
 |
[ Error trigger setting example 2 ]
 |
[ External trigger setting example 3 ]
 |
Upgraded Off-Line Analysis Capability
Data can be easily found amongst the huge volume of
recorded data by using the filter and search features.
Development efficiency is boosted to a higher level by using
color-coded customization features for packet types and
mark/jump features.
[Filter Condition Setting screen]
 |
[ Search condition setting
window example ]
 |
[ Search address/end point combination
condition example ]
 |
Statistical Infomation Function
It is possible to total and check the number of
transactions, the number of transfer bytes, and the average
transfer rate in the measurement log. The totaling range can
be specified with the mouse or the mark feature. The results
of totaling can be pasted to the table calculation software
through the clipboard.
Target area
| Entire
transactions/packets |
| Totals
all the measured data. |
| Selected |
Displays
this choice only when
transactions are
selected. |
| Mark * - * |
| Displays
[Mark * - *] only when
transactions are
marked. |
|
 |
Displaying/Hiding the
Packets
| You can display or hide each
type of the packets from the pop-up menu which appears
by right-clicking on each item of the packets. |
 |
Copying data to the spreadsheet
applications
By selecting the necessary range and
copying it to the clipboard with the Ctrl and C keys,
you can paste it to another application such as
Excel.
 |
Arranging data
Clicking the head of the table
helps arrange data in ascending or descending
order.
Initial screen |
Ascending |
Descending |
|
|
|
|
Effective Use of Data Saved in Text File Format
Users can copy, paste, and save selected ranges of measured data as compact text files. The files can be attached to reports or e-mailed to experts for professional analysis.
See the image of a text file saved
Expandable FPGA Firmware
Users can download the up-to-date version of the analysis software and firmware for the analyzer and keep the analyzer installed with the latest applications. Furthermore, the analysis software downloaded can be used as view software, thus it is possible to display measured data in detail on multiple PCs without connecting the analyzer.