| LE-1200 | : | Japanese model ( Japanese manual ) |
| LE-1200-E | : | World wide model ( English manual ) |
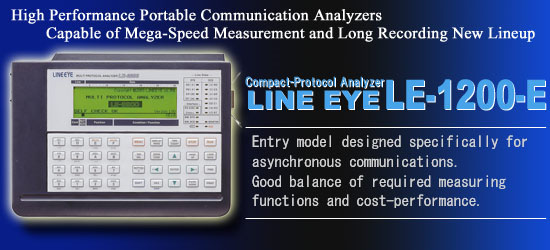
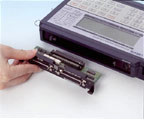
The LE-1200-E is a protocol analyzer for ASYNC communication supporting both RS-232C and RS-422/485. On-line Monitor function can analysis ASYNC communication up to 250Kbps in real time. The dedicated options allow it to support current loop and TTL communications.
| See options | LE-PC300G | Interface Sub Board | Option Table | |
| See details on product | Specifications | Appearance | Standard Accessories |
[ Features ]
| Can measure up to 250Kbps based on user-defined speed of 4 digits. | |
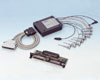
| Comes standard with RS-232C and RS-422/485. | |
| Comes standard with simulation and BERT functions. | |
| Can translate asynchronous PPP which is available over internet. | |
| Auto save function allows to continuously record data into the dedicated CF card of 1GB. | |
| Logic analyzer functions support 50ns resolutions for timing analysis in bits. | |
| Can use measured data on PC via an optional PC link software. | |
| Has a built-in nickel-hydrogen battery (8-hour use for 2.5-hour recharge). | |
| Compact size (B5 size and 940g), including a carrying bag to carry. |
Supports measurement of a Max. 250 Kbps
| Regardless of test conditions, such as trigger setting, LE-1200-E assuredly monitors and records full-duplex data communications of a max. 250 Kbps in real time. Recording is made into the buffer memory of the analyzer. | < Baud rate setting display
> |
Multi-Protocol Support
LE-1200-E comes standard with measurement interface for RS-232C (V.24) and RS-422/485 (RS-530) standards.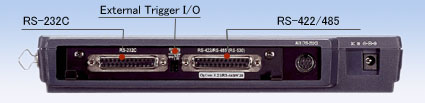  |
||||||||||
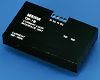
Expansion Kit Broadens the Range of UseRS-232C and RS-422/485 support comes as a standard feature. Using a dedicated expansion board helps you test 3V/5V TTL level (*) or current loop communications.* TTL level asynchronous communications (microcomputers or communications LSI asynchronous serial boards, etc.) are supported but not I2C or clock-synchronized communications.
|
Auto Save... Long Recording Time
| Built-in memory card (PC card) interface |
Memory card 2GB |
|---|---|
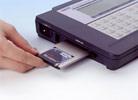 |
MC-2GCF |
*Before using MC-2GCF
If you are using LE-1200-E with the version such as 1.11 or before, please update to 1.12 or later. Firmware is available for downloading from the support page.
* When 1 kilobyte data is repeatedly transmitted by full duplex with intervals of 1m second idle time for each. Both transmission and reception data consume 4 byte of memory for each capture.
If you are using LE-1200-E with the version such as 1.11 or before, please update to 1.12 or later. Firmware is available for downloading from the support page.
| Target Line Speed (bps) |
Continuous Recording Time Reference | ||
|---|---|---|---|
| Main Monitor Only | When Using MC-512CF |
When Using MC-2GCF |
|
| 9600 | Approx. 4min. | Approx. 30hrs. | Approx. 120hrs. |
| 115.2K | Approx. 20sec. | Approx. 2.5hrs. | Approx. 10hrs. |
| 250K | Approx. 10sec. | Approx. 72min. | Approx. 5hrs. |
Logic Analyzer Display
Analyzes timing trouble in bits
| Communication line timing is
analyzed and displayed as a logic analyzer display to a
time resolution of max. 50ns. This function helps to
identify the problems with hardware. Also, you can use
it as educational use, comparing documents for
communications protocol. |
< Logic analyzer display
> Measurement between the cursors at 12 micro sec. |
PC Link
Use measurement data on PC via dedicated application.Manipulate measurement data on your own PC. By connecting the serial cable, the measurement log is recorded to HDD of a PC (*1). Moreover, the record log on a memory card are converted to the text format on a PC (*2) to use.
*1:Requires an option, PC software
(LE-PC300G).
*2:Includes software with the analyzer for converting saved data on the memory card to the text format and capturing the text output (printing data) from the analyzer.
(*) LE-1200-E
*2:Includes software with the analyzer for converting saved data on the memory card to the text format and capturing the text output (printing data) from the analyzer.
(*) LE-1200-E
Online Monitoring
| The online monitor feature records communications data in the capture memory and provides an easy-to-understand display for the type of protocol, without affecting the communication line. LINE EYE protocol analyzers record not only communications data but the time (time stamp) of transmission and reception as well as idle time. Therefore, failure time and timeout status can be checked. In addition, it is available for the trigger function which detects specific communication conditions and for the recording function to select the specific address frames which helps you to effectively use the memory. | Example of connection for online monitoring |
< Time stamp/idle time
display > < PPP translate display >  < Timing data display >  |
Line State LED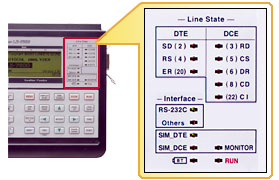 2-color LEDs show state of communications lines. |
Time Stamp Measurement
Record the data and the time of transmission / reception for data frames. ASYNC cannot recognize the length of frame. Thus, our analyzers decide the frame end when it find the specific character, or when it pass the specific time of being non-communication. Time stamp will be displayed in above 2 situations.* Specifies OFF, day / hour / minute, hour / minute / second, or minute / second / 10msec.
Non-communication state which works as the frame end detection time of ASYNC and Burst communications can be set from 1 to 100ms.
* The example indicates that received time of last data was 20min. 56.37sec(M / S / 10mS setting)
* If there are some frame with same time stamp, it is because the analyzer measured the frames in 10ms. (example : start from 20Mitute 56Second 370ms and 20Mitute 56Second 379ms)
Idle Time Measurement
The amount of idle time between communications frames can be measured.* Specifies OFF or a resolution of 100msec., 10msec. or 1msec.
* The example indicates there was an idle time of 7 to 7.9ms(1mS setting)
Trigger Function
The trigger feature allows you to specify
a communications event as the trigger condition and have
measurement operations executed automatically when that
condition is specified. Up to four pairs of conditions
and operations can be set, which is helpful towards
identifying frequent intermittent faults that occurs with communications systems.
And, the operation of a trigger condition can be
specified as the condition for another trigger, making
it possible to analyze complicated operations based on
sequential trigger.
|
< Trigger setup
summary display > < Trigger condition setup >  < Trigger action setup >  |
Delay Time Measurement
| Enables to measure min. / max. / average time of until some signal state is changed to another state and the number of its times. It is useful for delay analysis of control line RTS-CTS and so on. | < Delay time measurement display
> |
Simulations
Example of connection for simulation
MANUAL Mode
| The manual mode allows you to send data registered in the transmission table which corresponds to the "0" to the "F" keys. Data can be sent with the press of a key. While checking replies from a unit under development with the analyzer's monitoring feature, you can easily and simply test the communications process. You can also send fixed data by registering it under a key combination of the SHIFT and "0" to the "D" keys, as well as turn RS and ER signal lines on/off with the SHIFT and the "E"/"F" key combinations. | < Transmission table setup display
> |
FLOW Mode
| Flow control can be simulated on the transmission and reception-lines using X-on/off flow control or the control line handshake. In the transmission mode, up to sixteen cycles of data from transmission start until a generated interrupt request can be displayed. In the reception mode, you can set the number of received data cycles until a transmission interrupt request is generated, as well as the time until the transmission resume request is generated. | < Flow mode setup display
> |
ECHO Mode
In the echo mode, the analyzer internally return received data in units of bits, bytes or frames (character string). It is used to test display terminals and communications terminals, and to set loop-back points for the BERT feature.BERT(Bit Error Rate Test)
With BERT (Bit Error Rate Test) functions that comply with ITU-T G.821 Notification, you can evaluate quality of communication lines. They are helpful in measuring error rate in communications lines that include modems and terminal adapters, as well as in identifying failure points.< BERT measurement display
> Starting measurement updates the measured results of line quality in real time. With REPEAT mode, you can know the bit error rate of every specific time on a communication circuit. |
Example connection for BERT |
| Communication mode | Can select the ASYNC or SYNC mode. | ||||||||||||||||||||||||||||||
|---|---|---|---|---|---|---|---|---|---|---|---|---|---|---|---|---|---|---|---|---|---|---|---|---|---|---|---|---|---|---|---|
| Test Pattern |
|
||||||||||||||||||||||||||||||
| Pattern | 26-1, 29-1, 211-1, MARK, SPACE, ALT, DBL-ALT, 1in4, 1in8, 1in16, 3in24 | ||||||||||||||||||||||||||||||
| Measured Data |
|
Menu-Based Simple Operation
| Anyone can easily operate the analyzer owing to the easy menu selection system handed down from earlier models. Comparison table of asynchronous communications models |
< Top menu display > |
Offline Analysis Data Searches
Measurement data display can be freely scrolled and paged. A powerful search feature allows you to locate specific data and perform counting.| Search Key | Communications error (individual error type can be specified), communications data string of max. 8 characters (DON'T CARE and bit mask can also be specified), idle time beyond a specified duration, specific time stamp (DON'T CARE can also be specified), trigger matching data |
|---|---|
| Search Operation | Find and display, counting |
< Search key setting
> |
Using "DON'T CARE (*)," you can search for time stamp data from 10:30:00 to 10:39:59 as in this example. |
PC Compatible File Management Specification
Test conditions and results such as measured data can be saved on microdrives, compact flash cards and other memory cards in the file management format compatible with your PC. Of course, files can be interchangeably used between models such as LE-7200-E, LE-3200-E, LE-2200-E, and LE-1200-E. Therefore, measurement data can be saved on-site with LE-3200-E, and analyzed or manipulated in greater detail using LE-7200-E back in the office.* Not available to use memory cards for LE-1100-E.
| This function allows you to check files saved into memory cards by type, name, size, and/or date. | < File operation display
> |
| File type | Measurement data
(.DT), Trigger save data (TG SAVEnn. DT), Auto save data (#nnnnnnn. DDT), Measurement Conditions (.SU), Transmission data for simulation (.ST), Simulation Program (.SP) |
|---|---|
| File operation | Displaying normal file or designated type of files, Save, Load, Deletion, Format |
| When there are so many files
saved in a memory card, this function enables you to
specify the types of files you wish to display on the
screen. This image shows the
setup to display the trigger save data only from
Feb. 14, 2005 at 12:00 to Feb. 14, 2005 at
20:59. |
< File filter setup
> |
Updating to Firmware
You can download the latest version of software from our website to take advantage of the latest functions and features. - > DownloadAuto RUN/STOP for Unmanned Measurement
| By setting time and a data of measurement start and end, measurement can be done automatically during the specified time period. | < Auto run display > |
Various Print Formats
| Measurement data of a user-specified range can be printed out continuously from any printer. And, with a dedicated printer, you can print hard copy images of computer displays and continuous images of logic analyzer waveforms. | < Print out setup> |
Comparison table of asynchronous communications models
| Model | New Product LE-1200-E | Traditional Product LE-1100-E | |
|---|---|---|---|
| Interface | Standard | RS-232C, RS-422/485 | RS-232C |
| Option | TTL, Current loop | RS-422/485, TTL, Current loop | |
| Capture memory | 1.2M byte | 192K byte | |
| Transmission speed | 50bps to 250Kbps (user defined) | 50bps to 115.2Kbps (33steps) | |
| Protocol | ASYNC, asynchronous PPP (can select bit transmission order or bit polarity) |
||
| Time measurement | Idle time | Can select OFF, 100m sec.,10m sec., or 1m sec | Can select OFF, 100m sec,or 10m sec. |
| Time stamp | OFF, [date, hour, min.], [hour, min. sec.], [min., sec., 10m sec.] | OFF, [date, hour, min.],or [hour, min., sec.] | |
| Logic analyzer | Features such as 20MHz of sampling, time measurement, trigger, and displaying by zoom-in or out. | ||
| Trigger function | Sequential action | Single action | |
| Search function | Search designated errors, data strings, time stamp value. | ||
| Simulation function | Manual mode, Flow mode, and Echo mode | ||
| BERT function | Error rate measurement test in accordance with ITU-T G.821. | ||
| Memory card interface | Supports the dedicated CF card of 2GB. | Supports the dedicated SRAM card of 1MB. | |
| Power supply | Nickel-hydrogen battery | Nicad battery | |
| Dimensions, Weight | 240(W) x 180(D) x 39(H) mm, 940g | 240(W) x 170(D) x 39(H) mm, 940g | |